Market Talk with Piranha is currently moving to its new home at chrisperruna.com. The new site is up and running but many of the posts need editing as the images and stock charts did not transfer successfully (thanks blogger). I will post all new entries to both blogs – Thank you for your patience while I make this change!

Friday, September 29, 2006

Buy and Hold CANSLIM?

Today’s blog post is going back in time to look at a weekly screen I posted on MSW exactly two years ago to the week. My screens and research have evolved since 2004 but anyone can access the archives of MSW for free if the date is prior to the current year (2006). So what benefit does looking back two years give any of us? I don’t know if it will benefit anyone but it is rather interesting to view the performances of the stocks without considering any money management or sell rules.

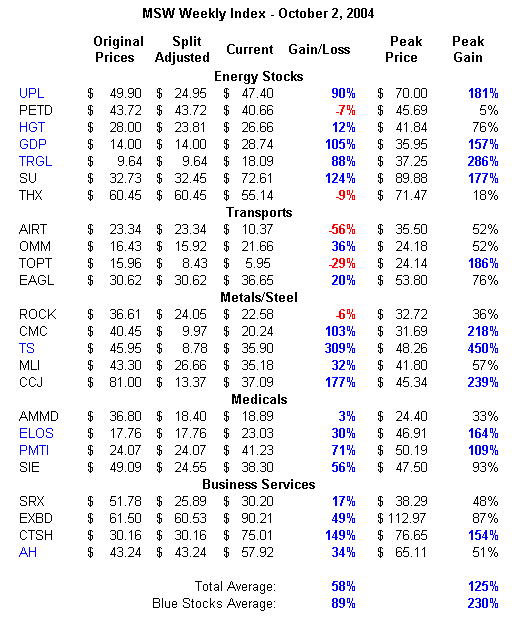
As a group, the 25 stocks are up 58% if you held each one to today (no rules). Of the 25 stocks listed (the stocks that still trade under that ticker), 20 of them are currently showing a profit if you were a buy and hold investor. If you only purchased the stocks that I highlighted in blue (details below), you would currently have an 89% gain and every one of the stocks would be in positive territory (UPL, HGT, GDP, TS, ELOS, PMTI, AH). The best performing stock from the screen is Tenaris (TS) as it has a current gain of 309% and a peak gain of 450% (from earlier in 2006). The combined peak gains for this weekly screen average 125% while the combined peak gain of the blue stocks average 230%. Not bad if you like to buy and hold without lifting another finger. I have owned several of these stocks over the past two years but I do not own any of the original shares from 2004.

The screen was based purely on CANSLIM methods that focused on earnings, relative strength and my own ability to read charts. That’s it – very simple. Three stocks have changed ticker symbols or no longer exist from the screen: (PKZ, DDN, LIFE).

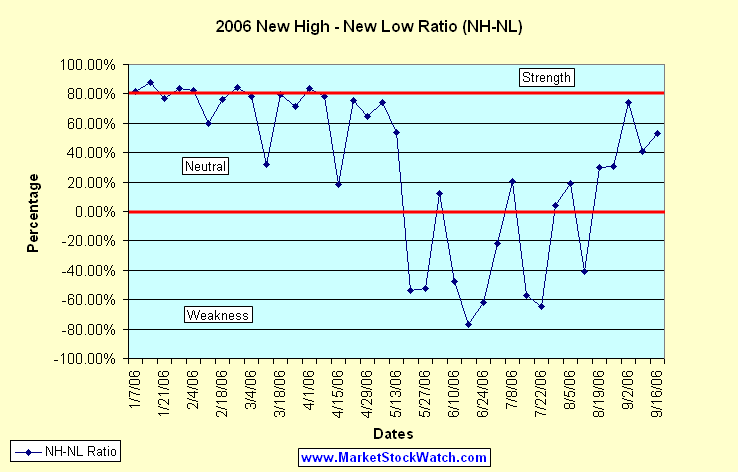
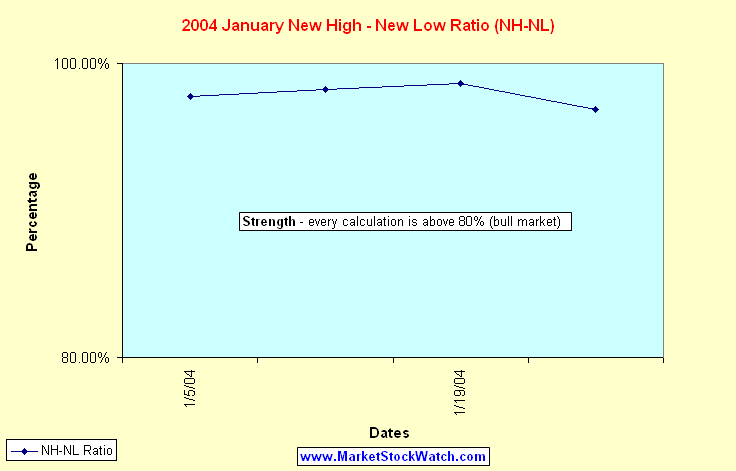
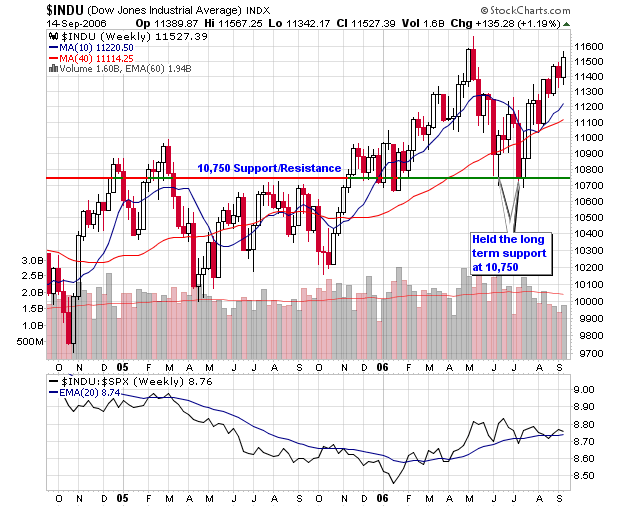
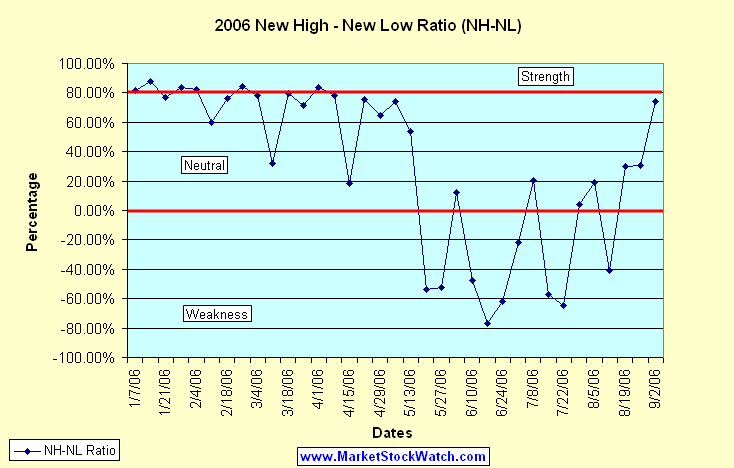
What you may find very interesting is the fact that I was using the NH-NL ratio to gauge the market back then and it was working beautifully just as it does today. The catch phrase “Sell in May and Go away” was also prevalent in 2004. I was also looking for opportunities in specific sectors just as Energy stocks and Metal stocks were topping my list. The maximum peak gains are rather hefty from these two sectors and I enjoyed some of the gains. I still hear market “talking heads” pump these same sectors today as they seem to be extremely late to the party. No matter what anyone says, CANSLIM works and works very well when integrated with proper money management techniques.

Here was the general analysis from the screen and an excel spreadsheet highlighting the gains and losses. Please note the “split-adjusted” column as several stocks have split one or more times.

Weekly Screen for 9/27/04 – 10/01/04
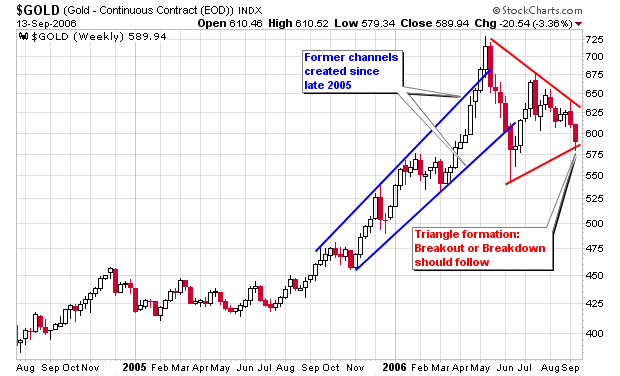
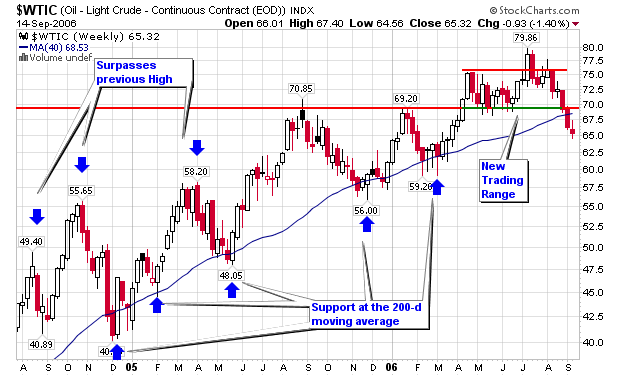
Strong Sectors: Energy, Transports & Metals/Steel

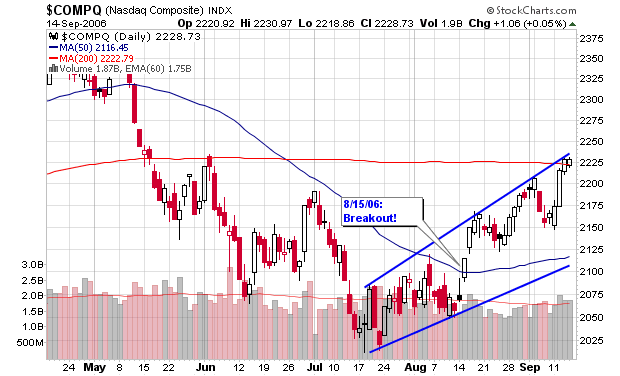
Market Overview: The markets are starting to show signs of life. My research is starting to tell a story. The NASDAQ gained 2.4% on Friday to end the week. Volume turned higher on Friday as the NASDAQ showed the most conviction in months. New highs, a key to my research, are starting to ramp up.

Let’s look at the story deeper by using hard data to support strength:
Monday showed New Highs (NH) vs. New Lows (NL) at 171-124, not very healthy.
Friday Showed the NH vs. NL ratio at 498-33.
We have not had strength like this since April 5, 2004 when the market flashed a new high vs. new low ratio of 553-14. We have not had new highs top 500 since that day in April, about the same time the market was starting to go to sleep.

I wrote this entry on my Weekly Screens on April 19, 2004:
Market Overview: The market is still in a confirmed rally according to rules but we are seeing many stocks hesitate and undecided about their direction. The world situation has been a big influence on the general market conditions. Speculation of an interest rate hike has kept the market in flux.
My screens showed bad news last week with the daily new highs and lows. For the first time since posting my screens in November, the daily new highs were lower than the daily new lows. I haven’t seen action like this since the bear market.”

My screens told a story then as they are telling a story now!

I have a new format for my weekly screens as the legend below will explain. Enjoy the work in the coming weeks as I post my weekly screens on this website. I have my own website that will launch in the coming weeks with daily screens, weekly screens and corresponding case studies that relate directly to the screens. On top of these features, I have an entire educational section for both fundamentals and technicals including top quality graphics (charts). Stay posted.

Legend:
Green Stocks: Excellent patterns, strong up-trends, supporting heavy volume, prime buying opportunities and solid RS lines.

Blue Stocks: Solid up-trends, nice volume, may be slightly extended, buying opportunity may still exist (refer to pivot and support levels).

Black Stocks: Confirmed up-trend, some sloppiness in pattern, extended from support areas, pattern may show weakening or slowing of advance, volume may be shrinking as stock advances, Stock may be a late stage base.

Red Stocks: Possible red flag in pattern.


Piranha
p.s. - one last thing; I am not a buy and hold investor but the "blast from the past" was fun!

Labels:

Wednesday, September 27, 2006

Big Caps still moving after 3 Months

Howard Lindzon made a blog post yesterday titled “New Highs are THICK and BIG BIG BIG CAPS in nature”

He goes on to write that companies such as American Express, Banc of America, McDonalds, Harley Davidson, International Game Technology, American Eagle, Autozone, Allstate, Nike, & Verizon are all looking good on the charts (possible breakout heaven).

I agree and have been writing about large caps making a move since July with my first major post highlighting McDonalds and the chart of the S&P 100 Index/S&P 600 Small Cap Index. TraderMike brought this chart to my attention earlier in the summer from his own blog post.

Here are the links to my original posts highlighting the gaining strength among BIG CAP stocks:


July 18, 2006
Large Caps Gaining Strength
"The chart associated with this post is telling us that Large Caps are gaining strength versus Small Caps. Time will tell but yesterday could have been the first round of confirmation."

July 17, 2006
MSW Market Overview
" tend to rely on the NASDAQ more so than the DOW but it is interesting to see that large caps are gaining some steam while small caps are getting trounced."

July 21, 2006
Ten Stocks to Watch
"The S&P 100 Index/S&P 600 Small Cap Index that I track is up over 6% this week for its largest gain in years, confirming that large caps are moving to the head of the class."

Piranha

Monday, September 25, 2006

Las Vegas Sands - LVS

I am sure many of you have seen the latest Forbes 400 list by now but if you haven’t, take the time to read over the list and pay careful attention to an article titled :
Another Hour, Another Million

The article is about Sheldon Adelson, the owner and CEO of Las Vegas Sands, LVS, a long time favorite of the MSW screens in 2006. The man was worth approximately $3 billion just two years ago but his wealth has skyrocketed to more than $20 billion since taking LVS public. According to the article’s calculations, Mr. Adelson, could surpass Bill Gates as the richest man on the planet by 2012 if all variables remain relatively equal. He has earned about $23.6 million per day and almost $1 million per hour over the past two years.

Why does this interest me? Because I have owned shares earlier in 2006 and currently own new shares in his public company: LVS. I bought shares back in the first week of April and sold them in July as the stock took out the 50-d moving average. After catching support near $60 in July (above the 200-d m.a.), I entered once again in August but have not profited this second go-around (at this point in time). I am now even with my latest position and have become concerned with the CEO making headlines with his own article in Forbes. I have learned from past market experts such as William O’Neil, Bernard Baruch and Gerald Loeb that headlines could be the sign of trouble ahead, at least for the stock.

Looking at the charts, my stop is near (slightly below) the support level of $60 so I will monitor the situation closely to make sure a loss doesn’t grow. I have already told a few people that a hedge to protect the down side may be warranted but the most important thing is to follow your rules and original objectives in the trade.

I have provided some of the analysis I have posted to the MSW Index over the past six months. I selected a couple entries from each month as selecting all would take up too much space on the blog. When listed on April 1, 2006, support was placed at the 50-d m.a. with an entry at $58. This was triggered the following week and away we went! The stock was up over 37% within three months on the MSW Index before topping and consolidating over the summer with support near $60. The stock was originally added as a $60-$100 candidate and was off to the races but hit a dead summer dry spell and corrected. Time will tells us when this stock is headed!


4/1/06: LVS makes its first MSW Index
LVS - 56.66, The stock has been screened many times (daily) over the past several weeks so I have decided to add it after further research. The stock comes to the Index as a possible $60-$100 candidate over the next twelve months. The strong 8% move this past week gives us the feeling that the young stock is ready to move. I am also looking at the September call options (in the money calls).

4/8/06:
LVS - 61.41, I said I felt the stock was ready to move and I was right as I added it to the MSW Index last week. The stock gained 8.38% on above average volume as it entered the $60 trading range. I see the stock settling down and pulling back a bit before resuming the advance. Rating: Hold

4/15/06:
LVS - 64.10, The stock continues to move higher and maintain its quick success on the MSW Index. This was a $60-$100 play so give it time to work out and stay patient. Rating: Hold

4/22/06:
LVS - 63.97, A break from the action this week as the stop slipped slightly as volume was near average. The stock is extended from the 200-d m.a. so look for a new entry to form. Rating: Hold

4/29/06:
LVS - 64.81, Earnings come out this Thursday so be ready for that up or down swing. If numbers keep in-line with past reports, I expect the stock to beat expectations and move higher (a hard stop is advisable to protect from bad news). Rating: Hold

5/6/06:
LVS - 71.32, Up over 7% on Friday, bringing the weekly gain to 10% after earnings came out positive. The move was anticipated if earnings stayed in line with the past (as I noted last week). The stock is up 26% in one month on the Index. Rating: Hold

5/13/06:
LVS - 68.12, Down 4.49% this week as the stock holds a RS rating of 95 and remains above the most recent breakout area of $65 (our first level of support) Rating: Hold

6/10/06:
LVS – 65.50, The stock is trading on the 50-d m.a. and managed to gather some support when it violated the line on Thursday. The market is weak but I still have the stock targeted for the run from $60 to $100. Rating: Hold

6/24/06:
LVS – 66.87, Still trading along the 50-d m.a. with an upward bias. This is the type of stock that I like to buy longer term options for the possible $60-$100 run. I would look at December or January options (in the money options are best IMO). The market is weak but I still have the stock targeted for the run from $60 to $100. Rating: Entry is now for $60-$100 run

7/01/06:
LVS – 77.86, What can I say - the stock broke out and is powering through the $60-$100 run regardless of the overall market environment. It traded sideways for seven weeks before making a huge move this week - signs of a great stock. Rating: Final entry passed last week

7/08/06:
LVS – 73.81, A pullback after the breakout last week. The stock is showing support above the short term $73 level. A break below $73 will probably bring the stock back towards $70. Rating: Wait to see if it will continue pullback towards $70

7/29/06:
LVS – 62.77, Last week I said: "The weekly chart shows strong support near $65 as a drop below this level will bring the stock back down near $60." As I said, the stock visited $60 and managed to close slightly above the area. Rating: the $60-$100 run has been hurt with major distribution in July but I am keeping the stock around for another week. It is does close below $60 and stay there, LVS is gone from the MSW Index.

8/12/06:
LVS – 60.33, Six consecutive down weeks but the weekly chart is still suggesting that buyers are starting to step back into the stock above $60. If it does close below $60 and stays there, LVS is gone from the MSW Index. Three weeks of distribution during the recent slide but a support area may be forming. Rating: Hold at current level with a sell below the 200-d m.a.

8/26/06:
LVS – 66.27, The stock is meeting resistance once again but has setup a double top breakout above $69 on the P&F chart. The decline last week did not qualify as distribution since the volume was below average. Still a hold in my book with the $60-$100 advance remaining a possibility as long as it trades above $60. Rating: Hold at current level with a sell below the 200-d m.a.

9/9/06:
LVS – 69.26, Clinging above the 50-d m.a. but volume was lighter on Friday as it moved forward by 2%. If LVS starts to struggle making higher highs, holders should become concerned. Institutional support is there but they can bail and the volume will be the story teller. Rating: Hold at current level with a sell below the 200-d m.a.

9/23/06:
LVS – 65.27, Sheldon Adelson has been making the news everywhere this weekend after his making a splash on the latest Forbes 400 richest list. He is the owner of LVS and has allegedly made just under $1 million per hour over the past two years. I am going to write a lengthy blog post about LVS and the appearance of the CEO all over the news. Could this be the start to a long slide? You heard it here first as I am now concerned. We all know that many stocks collapse when their CEO's make the major news networks and magazines. Rating: Hold at current level with a sell below the 200-d m.a. I may short sell if it closes below the 200-d m.a.


Piranha

Thursday, September 21, 2006

CLB was my Home Run

On August 30, 2006, I posted up a few short opportunities based on a strategy I have started to study and use. Similar to baseball, low averages can still make you a lot of money. What do I mean?

A player that hits .300 for a career or records an out 70% of the time has a good chance to make the hall of fame. The same holds true for stocks because a couple home runs here or there can make your entire year.

Core Laboratories will not make my year but it is one short that has made quite the impression my new technique. The stock is now down over 20% since I caught the short setup in late August. Yes, I am gloating but it’s because I am excited to see a home run so early while trading these new setups (new for me at least).

A CANSLIM investor may toss aside a 20% gain as average but this is not a CANSLIM tactic, it’s a short term strategy that is supposed to be closed within days and sometimes hours. CLB is still an open winning trade from a couple weeks ago as the stock has traded down 9 of the past 11 days but has never closed higher than the previous day’s high.


Volume has been larger on down days and the RSI has completely broken down. John Carter recommends that a trader should start watching intraday charts as the trade becomes extended so you can close out with a solid profit. However you setup your stop; DO NOT let the profit erode as that could be devastating to your emotional balance. Of the four stocks selected in late August, one worked in the short term, one failed miserably, one broke even and one was a home run. The losers or break-even stocks were cut short with minimal losses so they don’t matter to the overall portfolio. You can win 30% of the time in the market and still be very profitable! Here I recorded a 25% win ratio but the winner was big so it eclipsed the other trades and puts me in the green!

The original post can be found though this link:
Possible Short Setups

One last thing: you will notice that the gap-up from late July has been filled and it has taken two months.

Piranha

Tuesday, September 19, 2006

NH-NL Ratio still Neutral

After a great response to the weekly market review I added on Friday, I felt it was necessary to update the NH-NL ratio chart to show how this indicator feels about the market. We have had five consecutive positive weeks for the first time since April 2006 but we are hovering in a neutral zone near 40% with a brief spike above 70% a couple weeks back. The month of April 2006 averaged 64% while the first week was in bullish territory above 80%, something we haven’t seen since.


I often get a question about the difficulty of this calculation to stay above 80% and I respond with the ratios from 2003 and 2004. Below is a sample of the data extracted from January 2004 when the ratio averaged 97% for the entire month. The readings were as follows (chart below):

Sunday, January 4, 2004: 892-10 (97.78%)
Sunday, January 11, 2004: 792-7 (98.25%)
Sunday, January 18, 2004: 896-6 (98.67%)
Sunday, January 25, 2004: 505-8 (96.88%)


Where do the Major Indexes stand in 2006?
NASDAQ: +1.38%
DOW: +7.81%
NYSE: +8.21%
S&P 500: +5.84%

Below is an updated look at the weekly averages for the NH-NL Ratio:
Saturday, January 14, 2006: 500-32
Saturday, January 21, 2006: 348-46
Saturday, January 28, 2006: 516-46
Saturday, February 4, 2006: 449-44
Saturday, February 11, 2006: 229-57
Saturday, February 18, 2006: 306-42
Saturday, February 25, 2006: 420-36
Saturday, March 04, 2006: 399-49
Saturday, March 11, 2006: 162-84
Saturday, March 18, 2006: 459-53
Saturday, March 25, 2006: 312-52
Saturday, April 01, 2006: 441-39
Saturday, April 08, 2006: 481-58
Saturday, April 15, 2006: 150-103
Saturday, April 22, 2006: 540-75
Saturday, April 29, 2006: 353-76
Saturday, May 6, 2006: 503-74
Saturday, May 13, 2006: 384-116
Saturday, May 20, 2006: 64-211
Saturday, May 27, 2006: 57-182
Saturday, June 3, 2006: 119-93
Saturday, June 10, 2006: 72-204
Saturday, June 17, 2006: 41-310
Saturday, June 24, 2006: 56-238
Saturday, July 01, 2006: 127-198
Saturday, July 08, 2006: 143-95
Saturday, July 15, 2006: 74-273
Saturday, July 22, 2006: 66 - 307
Saturday, July 29, 2006: 163-151
Saturday, August 5, 2006: 194-132
Saturday, August 12, 2006: 88-210
Saturday, August 19, 2006: 178-96
Saturday, August 26, 2006: 140-74
Saturday, September 2, 2006: 285-42
Saturday, September 9, 2006: 143-60
Saturday, September 16, 2006: 244-75 - This Week

Piranha

Labels:

Monday, September 18, 2006

Interesting Gaps from Friday

I will be watching a few gaps from Friday to see how they play out this week:

Interesting Gap Ups:
ADBE - $37.00 (gap near $33.65)
FMD - $61.45 (gap near $52.35)


Interesting Gap Downs:
AHG – $19.92 (gap near $22)
CVTI - $11.99 (gap near $12.75)
DCX - $49.36 (gap near $52.50)
LNCR - $36.02 (gap near $37.50) – already filled a $2.50
PEG - $62.00 (gap near $66)


Piranha

Friday, September 15, 2006

Weekly Market Review

The NASDAQ is up almost 3% for the week as it has traveled from the 38.2% retracement level, thru the 50% retracement level to slightly below the 61.8% level. The highest retracement level is not important as I have been focused more on the 200-day moving average and the support/resistance level at 2,200. The NASDAQ is trading above the 200-d m.a. for the first time since May hence the statement “Sell in May and go Away”. I have been discussing and studying the markets around that statement strategy for three years now. It’s been very accurate since the bubble burst in 2000.


Looking at a daily chart, we can see the index is now trading between an upper and lower channel range with current prices touching the upper side. A move above this level will alert me that a short opportunity may become possible as the index would be too extended. Since today is options expiration day, I wouldn’t advise too much intraday activity.


Gold continuous contracts are forming a triangle pattern as noted on the chart with red lines. The former trading range between $600 and $650 no longer applies as we are now below $600 for the first time in months. This will be an interesting play but don’t jump the gun and enter before a signal to either side.


Crude oil contracts are trading at their lowest levels since March and are in a clear downtrend with 17 of the last 27 days giving us a loss. If you look at the weekly chart, you can see that Crude has violated the 200-d m.a. in the past and recovered so I am not sure if it is ready to turn over yet. I don’t suggest a long position until the contracts can recover their 200-d m.a. and the former support line which now acts as resistance. It is very important to wait for the signal before entering a trade because the market doesn’t follow what you “think may happen”. Let the market show you what it wants to do and then trade what it is saying.


Due to the weakness in crude, the NASDAQ-Crude combo index is now above the long term down trend line for the first time in years. We have rallied several times over the past five years when October shows its face and this year could be similar. I don’t know if this is the start to a further rally or just another head fake in 2006. This combo index is purely a secondary indicator so don’t make any decisions based solely from this chart. This chart is here to confirm your beliefs from other front line indicators such as price and volume and that’s it.


Moving on to the DOW and S&P 500, we can see clear cup shaped bases that are currently building the right side. The S&P 500 base is a bit more rounded than the DOW as I would like to see handle formation before a move to new highs. I know the market doesn’t care what I want but both indexes are up about 10% since their bottoms from earlier in the year so we need to shake out the weak holders before making new highs.


Speaking of highs, the DOW can attempt to make an all-time high if it continues to push north. If we really want to dissect this chart, we can say that a seven year cup shaped base has formed as we are about to close the right side of that pattern and possibly form a handle. I don’t typically look at bases in yearly terms but I couldn’t ignore what I see.


Finally, all of this means nothing to me if the New High – New Low (NH-NL) ratio can’t confirm the action. As a CANSLIM trend trader, I am not prepared to make any long commitments until I can see the NH-NL ratio consistently reach 500 news highs per day and individual leaders making new highs on above average volume. Some individual stocks are acting this way but many more are still reversing after their false breakouts.

Trust me, when the NH-NL ratio starts to record 500-800+ new highs per day, we will be well on our way to the next sustainable bull market. Until then, play the short term moves and always employ solid money management techniques and always sell losses short!

Have a great weekend,
Piranha

Labels:

Thursday, September 14, 2006

Did CXW Work?

I don’t even know if I followed the correct rules but I made a small profit so I’ll take it and review what I did. Here’s the updated chart of CXW. See my last post from earlier in the week to understand what I was looking at.


Piranha

Tuesday, September 12, 2006

A New Short Candidate & Updates

I wrote a post prior to the market open on August 31, 2006 and uploaded four charts of stocks that may be showing a possible short based on a simple bearish divergence technique I have been studying. Three of the four stocks have showed profits with CLB breaking down with the largest profit opportunity.

Based on that blog entry, I have decided to update what has happened over the past couple of weeks and present a new opportunity from my research tonight.


Corrections Corp. of America:
CXW – 66.18,
a 4.38% gain on volume only 36% larger than the average. I see a huge bearish divergence on the charts with a short setup. The entry is the day after the stock closes below the previous high which is $65.

As you can see, each stock did make a gain on the short side but the charts show why a couple of them didn’t set up properly. I would also suggest to use an intraday chart to close the position rather than a daily chart. Please see the original post to understand what I was looking for: Possible Short Setups

The stocks listed on 8/30/06:
PSPT - 16.92 (low 15.45 9/7/06) – 8.69%
CLB - 73.00 (low 67.00 9/11/06) – 8.22%
CTSH - 70.60 (low 68.09 9/11/06) – 3.56%
BMC - 26.97 (low 26.16 9/7/06) – 3.00%


I am new to short term trading (long time CANSLIM trend trader/swing trader) and will continue to use the blog to post up what I am looking at with equities.

Piranha

Monday, September 11, 2006

Never Forget

Born and raised in NY, I will never forget!


On September 4, 2001, I slipped a quarter into a machine atop the observation deck of the Liberty Science Center and zoomed into the beautiful buildings across the river. I was spending an extended Labor Day weekend with my future wife as we decided to go to the museum in New Jersey. We took pictures and viewed the two massive towers and Statue of Liberty on a beautiful Tuesday afternoon; exactly one week prior to the tragic events of 9-11-2001.

Little did I know that I would stand in horror watching those towers burn and fall exactly one week later from my office parking lot north of Manhattan in Westchester county (just up the Hudson River, the same Hudson River that separated me from the towers seven days earlier).

I was working for a historic preservation architectural firm at the time and we decided that we needed to contribute to the possible rebuilding of the site. We entered as one of the thousands of members into the World Trade Center Site Memorial Competition. You are welcomed to view our submission through this link or by searching for #790898 on the official site.


I am proud to be a “New Yorker” at heart even though I currently reside in New Jersey and I will never forget because so many heroes died and were born at the same time that day.

Chris Perruna

Friday, September 08, 2006

Crude Oil Opportunity?

Oil has recovered every time at the 200-d m.a. Is this a buying opportunity?

We see five opportunities in the past two years at this long term moving average.

Take the trade (buy options if you want leverage or use futures contracts). What ever you do, sell a small loss and move on if it doesn't work. Investing is that simple.


Taking trades with a favorable risk to reward ratio. It seems to me that a long position would be ideal even if I am wrong because the reward could take us back towards $80. I am looking at a 2-3 point loss for a possible 10 point gain (minimum 3-to-1 odds with a possible 5-to-1 pay out).

Cut all losses short if the trade fails! (In December 04, crude cut the 200-d m.a. sharply only to recover).


It’s not about being right or wrong; it’s about being able to push the odds in your favor, take the trade and follow the rules. If it doesn’t work – OH WELL! Move on!

Piranha

Wednesday, September 06, 2006

InstantBull has caught my Attention

This blog entry is going to focus on a recommendation for one site and I don’t normally do this but I have been using the features of InstantBull more and more over the past few weeks and have become hooked. The speed of finding information on the web while staying at one internet address is amazing. I can find general market analysis from seven or eight main sites while searching under the summary section or I can go directly to the blogs tag and search 40 of the top financial blogs without much effort or any pop-ups.

Finding news, key stats, sec filings, earnings, ratings, historical numbers, options or any other relevant information is at my finger tips like my own favorites list through my browser. The technology that has been developed by InstantBull is excellent in my opinion and that is why I am making a single post to promote the service. It is free and I am not getting any benefits in return (I swear). It helps that my blog is listed at number eleven but that didn’t influence me to write this article. I have pumped other sites in the past solely because I use them on a daily basis and that is the same reason why I point out this new site (many of you may have not heard of it). It’s not very often that a site is born that I start to use every day but InstantBull has fell into that category.

It is not limited to financial information as it also has a general web tab and news tab. I liked it from day one but it has grown on me even more over the past couple of weeks as I prepare my research each night for the MSW screens. By the way, if you like message boards, they have a great feature that allows you to search topics from several sites on your favorite stocks while staying in one place. Without stretching the blatant endorsement of the site, take the time to visit it yourself and start using their great portal.

Check it out!

Here are two other sites I use each night along with InstantBull:
Stockcharts.com
Investors.com (for eIBD and Daily Graphs)

Piranha

Monday, September 04, 2006

Looking at the Market through the NH-NL Ratio

My first topic of discussion is the NH-NL ratio, something I ignored for the majority of the week. As you can see on the list below, we had our third consecutive positive week, the first time since late April and early May and we had the best ratio with the largest number of new highs since the week ending May 13, 2006. Every day was consistent this week without any one day skewing the numbers. The strength wasn’t overwhelming but it wasn’t weak either as the number of new lows fell to the lowest weekly average since the week ending April 1, 2006. The ratio percentage number ended at 74.31%, the highest reading since the week ending May 6, 2006 (74.36%). Notice the higher highs and higher lows on the chart.


Looking back at last year’s numbers, we can see that the entire month of September (2005) was positive with the monthly ratio coming in at 280-85. The largest weekly new highs average was 375 while the largest weekly new lows average was 157 (the final week of the month). The first week of October was positive but we then slipped into three consecutive negative weeks before heading back to positive territory for the next 28 weeks (starting November 5, 2006 and ending May 20, 2006). The phrase “Sell in May and go away” couldn’t have been more appropriate based on this real time data collected on MSW weekly screens. November through April are supposed to be the best months to invest according to historical data provided by the Stock Traders Almanac and this NH-NL ratio data over the past twelve months has proven it to be 100% correct!

As I have mentioned many times in the past, big time Wall Street fund managers and institutional traders go on vacation to the Hamptons, upstate lake side homes and international destinations. While these investors leave, they sell their weak holdings and have their staff sell anything that becomes weak while they are gone. They basically clean house and sell any investments that can’t survive while that are not at the helm. This results in the thin volume that we see year in and year out from June to August. When they get back in September, they continue to clean house and look to revamp their funds and close on a positive note, heading into the New Year. This is not rocket science; look at historical charts for the DOW and NASDAQ and you will see that September and October have provided many lows in the markets over the past few decades. More recently, it has happened in 2001, 2002, 2004 and 2005 (2006?).

Mentioned in the past and according to Elizabeth Thompson’s article ‘Gone away for the Summer? It’s Time to Come Back’, she states, “that the financial world encourages investments in the November through April period more so than in the May through October period.” She further states that January is the month that employees sign up for 401(k) plans while IRA’s have an April deadline which requires investors to place more money in their stock related retirement funds. This type of setup brings an influx of money to the table during the beginning of each year and naturally pushed prices higher before the flat summer months when they typically correct.

September is historically one of the worst performing months in American stock market history but it can also present an ideal opportunity to place positions on stocks that are showing excellent relative strength. Typically, these stocks go on to be market leaders and breakout after Halloween and into the New Year. November through February are some of the best performing months in Wall Street history but if you wait to place positions at the end of this range, you may be buying extended stocks that are poised to drop as the spring ends, creating losses in your portfolio. There are always exceptions to historical data and the rules so we want you to follow the daily and weekly action of the market before buying and selling. History is great but it doesn’t mean the market will always follow the script (if you know what I mean).

Another study suggests that the market will continue do trade the way it has traded for the first five months of the year. If this scenario holds true to 2006, we will be stuck in a sideways market for another four months. Regardless, I will be here researching the leaders and trends and will give you my best analysis outside of predictions and historical data. I feel that this historical data can help some investors realize that the market does work in predictable ways from a long term macro view.

Follow my three most important Indicators:
1. The price and volume of the major indexes (currently moving higher)
2. The action on the NH-NL ratio (3 positive weeks but lacking overwhelming strength)
3. The action among leading individual stocks (very solid week: 3.55% MSW Index gain)

Where do the Major Indexes stand in 2006?
NASDAQ: -0.55%
DOW: +6.97%
NYSE: +8.79%
S&P 500: +5.02%

Below is an updated look at the weekly averages for the NH-NL Ratio:
Saturday, January 14, 2006: 500-32
Saturday, January 21, 2006: 348-46
Saturday, January 28, 2006: 516-46
Saturday, February 4, 2006: 449-44
Saturday, February 11, 2006: 229-57
Saturday, February 18, 2006: 306-42
Saturday, February 25, 2006: 420-36
Saturday, March 04, 2006: 399-49
Saturday, March 11, 2006: 162-84
Saturday, March 18, 2006: 459-53
Saturday, March 25, 2006: 312-52
Saturday, April 01, 2006: 441-39
Saturday, April 08, 2006: 481-58
Saturday, April 15, 2006: 150-103
Saturday, April 22, 2006: 540-75
Saturday, April 29, 2006: 353-76
Saturday, May 6, 2006: 503-74
Saturday, May 13, 2006: 384-116
Saturday, May 20, 2006: 64-211
Saturday, May 27, 2006: 57-182
Saturday, June 3, 2006: 119-93
Saturday, June 10, 2006: 72-204
Saturday, June 17, 2006: 41-310
Saturday, June 24, 2006: 56-238
Saturday, July 01, 2006: 127-198
Saturday, July 08, 2006: 143-95
Saturday, July 15, 2006: 74-273
Saturday, July 22, 2006: 66 - 307
Saturday, July 29, 2006: 163-151
Saturday, August 5, 2006: 194-132
Saturday, August 12, 2006: 88-210
Saturday, August 19, 2006: 178-96
Saturday, August 26, 2006: 140-74
Saturday, September 2, 2006: 285-42 - This Week

New highs vs. new lows from last week:
Monday showed a ratio of 221-52
Tuesday showed a ratio of 260-59
Wednesday showed a ratio of 351-39
Thursday showed a ratio of 293-25
Friday showed a ratio of 299-35

Piranha