Determine a Stock’s Price target
 On Saturday, I added Sterling Construction Company (STRL) to the MSW Index as a non-traditional play. Why is it non-traditional for MSW? Because it was not breaking into new high territory as we screened it onto the Index. I said:
“This is not a typical MSW Index play but I see up-side potential on the chart after the correction in the $20 range and the support at the moving average. The down-trend was also broken as I will show you on the MSW Index charts. Rating: Buy (target is $30 in 2006)”
After giving a target price, I was questioned by a member as to how I came up with $30. I don’t teach how to develop price targets because there are many methods and none of them are extremely accurate and some vary greatly with their predictions. I don’t want to give false hope with a price target and I definitely don’t want to get sued by a member that believes a stock is going to reach a certain point based on my analysis. I run an equity research and education site, not an analyst firm so I am more concerned with finding stocks with the potential to move higher based on fundamental and technical analysis and not price targets (or upgrades and downgrades).
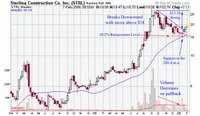
The stock entered the MSW Index at $18.93 on 2/4/06 with support at the 200-d m.a. I will show you two methods I use to develop price targets and then tell you why I picked $30 as a possible target based on the information provided by the two methods.
The first method to determine if the stock had bottomed is the use of the Fibonacci retracement levels (in this case, the 38.2% retracement which equals $15.46). It turns out that this retracement level also corresponds with the 200-d m.a. support and lifted the stock higher. Turning to the retracement level on the positive side, the method predicts a top at three common locations:
61.8%: $23.26
50.0%: $21.13
38.2%: $20.13
I also use another method that I first learned about in Stan Weinstein’s book “Secrets for Profiting in Bull and Bear Markets” called the swing method. This method takes the peak number ($28.35) and subtracts the bottom number ($15.05) to give us a swing number of $13.30. This was the size of the correction of the swing from $28.35 to the bottom at $15.05. Weinstein states that you take the swing number ($13.30) and add it to the peak number ($28.35) to give you a price target of $41.65. You can read more about this in chapter 6 of the book.
I now have two price targets that are completely different:
Fibonacci 61.8% retracement of $23.26
Weinstein swing method of $41.65
My target of $30 was developed by looking at the pattern and determining that the stock will most likely top near $30 if the former 52-week high is surpassed. The Weinstein method is accurate with CANSLIM type stocks and the Fibonacci method is very accurate when determining a pullback area.
Bottom line: everything is just a guess based on a certain set of parameters and information. No one truly knows where it will go. Place the position, set a sell stop slightly below the moving average and see what happens. If the stock gains more than 25% in the first few weeks, place a trailing stop to protect profits. Follow the rules and you will make money on winning trades and lose small amounts on losing trades. In the end, it should work out in your favor if you place several trades throughout the year. Several winning trades and several losing trades but the winners should be larger than the losers, keeping your portfolio in the black!
Piranha


0 Comments:
Post a Comment
<< Home