Market Talk with Piranha is currently moving to its new home at chrisperruna.com. The new site is up and running but many of the posts need editing as the images and stock charts did not transfer successfully (thanks blogger). I will post all new entries to both blogs – Thank you for your patience while I make this change!

Saturday, January 13, 2007

My Latest Blog Entries

If you don't know by now - Market Talk with Piranha is now located at www.chrisperruna.com

Here are a few of my latest blog posts:

Intercontinental Exchange (ICE) is HOT

Iconix Brand Group (ICON)

Apple Inc. is Still Green

Medical Properties Trust Inc. (MPW)

Silver Wheaton Corporation (SLW)

The Holy Grail of Weight Loss

Wall Street does Create Something

See you on the other side,
Piranha

Tuesday, December 12, 2006

Latest Articles uploaded on New Blog

Latest Posts added to chrisperruna.com:

ICE, BOT and ISE Updated

Wednesday, December 06, 2006

Super Speculation – Yes – Tips are for Suckers:

Many of you may have heard of Calpine and how they went into bankruptcy and how they are selling various parts of their business. I was recently having a conversation with someone in the industry (hedge fund) and they mentioned how several traders are going long Calpine (CPNLQ) on pure speculation based on rumors that the company may restructure and move forward. I don’t know if it is true but I took a look at the chart after his request and see that the stock is up several hundred percent on very heavy volume since late October but is extremely extended above the major moving averages for the first time in years. It closed at $0.91 on Tuesday (down from the $1.23 peak) as some people believe it is worth $6 per share.

I have no idea if this is true and I have always been taught that TIPS ARE FOR SUCKERS so please beware if you decide to speculate with extreme risk. I take this information as a tip even though my friend is a childhood buddy but I am curious to watch what will happen.


Again – this is by no means a recommendation to buy and major losses could occur if you were to speculate in this stock (I must make these statements to protect the legal aspect of my words). None of the stocks on this blog are buy or sell recommendations; just equity research based on specific criteria as noted in my disclaimers!

I prefer to buy stocks making new highs and I am not a bottom fisher. The only reason I even present this stock is because a very good friend of mine asked me to look at the chart and I thought I would share since I did the analysis.

Disclosure: I do not own any shares in Calpine (CPNLQ)!

-Chris

Labels: ,

Tuesday, December 05, 2006

Moving to WordPress

I am finally making the change and it is painful at times, especially since there is no import from blogger beta to WordPress (I should have stayed on the regular blogger platform). I used my RSS feed to get my text over to my new WordPress blog but most of the images and charts do not show up. The charts and images occasionally show through IE7 but not through Firefox 2.0. It looks like I will have to re-enter my 238 posts with images from my new server (MY OWN SERVER –finally) or I can wait for a more advanced import tool from WP. My other problem will be the links to blogger titles in many of my posts. I will keep the blogger blog for a while but don’t want duplicate content on two sites as it will hurt the page ranking of both (from what I understand).


In any event, please bear with me over the next couple of weeks as I make the full transition from Blogger to WP as I am just learning the software and will be testing tools and widgets, etc…

My new blog and future home will be at http://www.chrisperruna.com/. I will continue to blog primarily about the stock market but will add a few more subjects that may interest my readers. Take a look and let me know what you think.

Thanks,Chris

Friday, December 01, 2006

New High - New Low Ratio

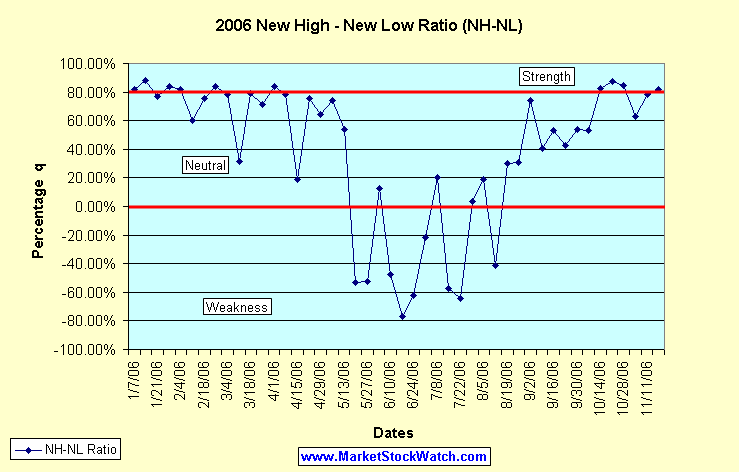
Here’s the latest NH-NL ratio chart with weekly numbers updated to the week prior to the Thanksgiving holiday. I excluded the short week so it wouldn’t skew the chart. Although the week ending on Saturday, November 18, 2006 had the highest average number of new highs (541) for the year, the strength calculation ranked it tenth in 2006 behind many of the readings from January and October. New highs were greater during the week of 11/13-11/17 but the strength was less than three of the weeks in October which saw the number of new lows 30%-50% lower. Both sets of numbers play an equal role in the calculation of this NH-NL strength ratio.


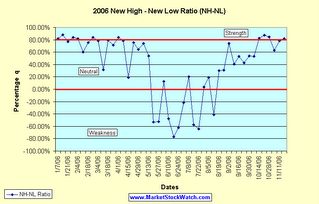
Yesterday saw a reading of 525-35 which equals an 87% rating but the readings were weaker earlier in the week so the total won’t make the top 10 (as long as today is quiet). In addition to the NH-NL chart, I wanted to post the chart of the number of stocks on the S&P 500 that are trading above their 50-d m.a. because it has slipped to its lowest level since August.

To calculate the percentage correctly, use this formula:
(New Highs – New Lows) / (New Highs + New Lows) * 100 = X%

Below is an updated look at the weekly averages for the NH-NL Ratio:
Saturday, January 14, 2006: 500-32
Saturday, January 21, 2006: 348-46
Saturday, January 28, 2006: 516-46
Saturday, February 4, 2006: 449-44
Saturday, February 11, 2006: 229-57
Saturday, February 18, 2006: 306-42
Saturday, February 25, 2006: 420-36
Saturday, March 04, 2006: 399-49
Saturday, March 11, 2006: 162-84
Saturday, March 18, 2006: 459-53
Saturday, March 25, 2006: 312-52
Saturday, April 01, 2006: 441-39
Saturday, April 08, 2006: 481-58
Saturday, April 15, 2006: 150-103
Saturday, April 22, 2006: 540-75
Saturday, April 29, 2006: 353-76
Saturday, May 6, 2006: 503-74
Saturday, May 13, 2006: 384-116
Saturday, May 20, 2006: 64-211
Saturday, May 27, 2006: 57-182
Saturday, June 3, 2006: 119-93
Saturday, June 10, 2006: 72-204
Saturday, June 17, 2006: 41-310
Saturday, June 24, 2006: 56-238
Saturday, July 01, 2006: 127-198
Saturday, July 08, 2006: 143-95
Saturday, July 15, 2006: 74-273
Saturday, July 22, 2006: 66 - 307
Saturday, July 29, 2006: 163-151
Saturday, August 5, 2006: 194-132
Saturday, August 12, 2006: 88-210
Saturday, August 19, 2006: 178-96
Saturday, August 26, 2006: 140-74
Saturday, September 2, 2006: 285-42
Saturday, September 9, 2006: 143-60
Saturday, September 16, 2006: 244-75
Saturday, September 23, 2006: 206-83
Saturday, September 30, 2006: 251-75
Saturday, October 7, 2006: 301-92
Saturday, October 14, 2006: 412-40
Saturday, October 21, 2006: 442-29
Saturday, October 28, 2006: 480-40
Saturday, November 4, 2006: 251-57
Saturday, November 11, 2006: 388-48
Saturday, November 18, 2006: 541-55 - most new highs in 2006 (weekly average)
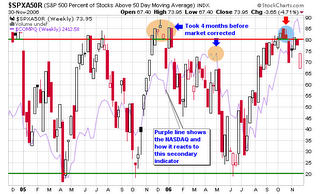


Piranha

Labels:

Wednesday, November 29, 2006

Baby Boomer Bust is BULL

This article was originally written last summer but I wanted to bring it to the top of the blog after reading Bill's lastest post over at No DooDahs.
“Boomer Bust?” I Don’t Think So!

I couldn't agree more and can't wait to read his full argument!

July 14, 2006:
I want to post about a subject that frequently appears in discussions online in recent years (especially over the past several months). It's about authors and their sheep followers that continue to predict these great depressions and crashes. I am not saying that it can't happen but their readers sure make them rich by reading most of their negative crap. What happened to the predictions from the books in the late 1970’s and early 1980’s? Read the book titles from the 1970’s and 1980’s and then read the book titles from today (listed below). Are you seeing a pattern? I didn’t go back to the 50’s or 60’s but I could find similar titles and then many more in the 1930’s. My point is: don’t believe everything you read and stop panicking by reading books from theorists (talkers, not doers). I must give credit to many of the books listed by Martin Schwartz and his book Pit Bull. I enjoyed reading it over my last vacation as it was very funny and educational (not a “how to” book).

Theorists make money selling books that sell fear while investors and entrepreneurs make money by following their ideas with money and hedging against a possible crisis. I learn from history and history shows us that these “crisis” books will always sell during tough times. Readers eat up this garbage because most people are trapped in the rat race working their asses off just trying to stay afloat. Their attitudes are typically piss-poor and they love to read about huge negative events (especially a crash that may hurt others).

Also notice how the same authors try to write books when the market starts to go back up again. For example, Howard J Ruff was writing about the crisis in 1979 through 1982 but then started to write about how to invest as a serious investor in 1987. Guess what: he was on the wrong end of the crisis in 1982 (the tail end) and the wrong end of the boom in 1987 (crash later that year). These “fools” are always late to the party and sell millions of books to the “average” person that engrosses themselves in fear!

These people, both now and then are not very accurate, they sell garbage in my opinion and I ignore it at all costs! I just hope many of you can do the same and make decisions based on what “YOU” see and not based on book sellers! Invest for now, ignore the garbage but be prepared for worst case scenarios by taking necessary steps but don’t radically change your life based upon the writings of a few authors that probably don’t invest themselves.

Books from the Past:
Crisis Investing: Opportunities and Profits in the Coming Great Depression by Douglas Casey (Hardcover - Jul 1980)

Crisis Investing for the Rest of the 90's by Douglas Casey (Hardcover - Oct 1993) - WOW was this wrong in 1993!

What the smart money is betting on in 1985: By Doug Casey by Douglas R Casey (Unknown Binding - Jan 1, 1985)

The Coming Currency Collapse and What You Can Do About It by Jerome F. Smith (Hardcover - Sep 1980)

Profits from silver by Jerome F Smith (Unknown Binding - 1983)

How you can profit from the coming devaluation by Harry Browne (Unknown Binding - 1970)

You can profit from a monetary crisis by Harry Browne (Unknown Binding - Jan 1, 1975)

How to Prosper During the Coming Bad Years - A Crash Course on Personal and Financial Survival by Howard J. Ruff (Mass Market Paperback - 1979)

How to Prosper in the Coming Bad Years by Howard J. Ruff (Mass Market Paperback - Jul 1981)

Making money: Winning the battle for middle-class financial success by Howard J Ruff (Paperback - 1986)

Howard Ruff's crash course for the serious investor by Howard J Ruff (Unknown Binding - Jan 1, 1987)

How to Prosper During the Coming Bad Years by Howard J. Ruff (Paperback - April 1984)


Books from Today:
The Coming Collapse of the Dollar and How to Profit from It : Make a Fortune by Investing in Gold and Other Hard Assets by James Turk and John Rubino (Hardcover - Dec 28, 2004)

The Coming Economic Collapse : How You Can Thrive When Oil Costs $200 a Barrel by Stephen Leeb and Glen Strathy (Hardcover - Feb 21, 2006)

Defying the Market: Profiting in the Turbulent Post-Technology Market Boom by Stephen Leeb and Donna Leeb (Hardcover - Jun 3, 1999)

Empire of Debt : The Rise of an Epic Financial Crisis (Hardcover) by William Bonner, Addison Wiggin (November 11, 2005)

The Great Bust Ahead: The Greatest Depression in American and UK History is Just Several Short Years Away. This is your Concise Reference Guide to Understanding Why and How Best to Survive It (Paperback) by Daniel A. Arnold (November 25, 2002)

Image courtesy of http://mirrorimageorigin.collegepublisher.com/media/paper144/stills/x5jf138r.jpg

Piranha

Labels: ,

Tuesday, November 28, 2006

Make Money Selling Short

The headline may sound weak but I borrowed it from the book “How to make Money Selling Stocks Short” By William J. O’Neil. It’s not a book your typical day trader or professional scalper will be interested in reading but it’s ideal for people like me that still trade longer term trends and don’t necessarily do this for a profession. I intend to travel that road one day but now is not my time so I must stick with techniques I believe work and have “actually” worked for me in the past (and present).


I jumped on the potential band wagon early and started to screen for shorts back in early October and I was wrong. More recently, I placed a few positions and was both right and wrong as the market trend was still moving higher and I knew this but I was conquered by human emotion to make the short trades anyway. Luckily for me, two of the trades show a profit while three losers kicked me quickly for smaller losses.


What do I look for when searching for shorts in what I consider reverse CANSLIM? It’s simple; I read the book by O’Neil, study the charts from the past and look for those same characteristics in stocks trading today.


Many traders believe that the most obvious area to place a short would be near the peak of stock’s trading range but I have found this to be untrue.

Characteristics of Longer Term Trend Shorts

  • Most ideal longer term “trend” shorts take four to twelve months after the peak price to setup on the weekly chart with the majority of these shorts triggering between six to nine months.

  • Look for stocks that had prior up-trends and support levels that can now act as downward resistance or entry areas.

  • Once a stock tops and starts to consolidate, you want it to slice through the 50-d moving average and then the 200-d moving average.

  • A crossover between the 50-d m.a. and the 200-d m.a. is ideal and is graphically presented on each chart in this post

  • The odds of success increase with each failed attempt for the stock price to recover these major long term moving averages.

  • Head and shoulder tops can also serve as ideal setups for potential shorts if they take at least five months to develop.

  • A decreasing relative strength line and a negative pattern on the point and figure chart can also confirm that the stock is rolling over and setting up an ideal short.

  • Finally, volume should be increasing and the stock should be under distribution as it violates the major moving averages and starts to break former support levels.

No one knows when this market will roll over so study the ideal characteristics now so you are prepared to recognize them when they appear. I have screened about two dozen potential shorts in November on MSW with several of them working while the others have failed. I was early with my analysis but more stocks seem to be building bases like the ones from the bubble burst in late 1999 and early 2000. Compare the three examples from today that I have posted to the four shorts from the past that setup perfectly if you would have recognized them six years ago.


For further reading, see my two part article on shorting and the book by O’Neil – the charts alone are worth the price!

Shorting Stocks – The Basics, Part I of II

Shorting Stocks – The Basics, Part II of II


Piranha

Labels: , ,