
A Negative New High-New Low Ratio (NH-NL)
 We witnessed our first negative daily New High–New Low (NH-NL) ratio since Wednesday, November 16, 2005 when it closed at 103-207. The NH-NL ratio closed at 88-93 on Tuesday as the market presented us with the fewest number of quality stocks making new highs since last year. I have been backing off of the idea that a “rally” has been forming as claimed by other market sources and I have pointed to my three main indicators to explain why I have been playing defense since early February. Below I have listed some of the quotes that I made on the weekly screen from 2/11/06. On Monday, the NH-NL ratio finished at 271-77.
I have pasted the weekly NH-NL numbers from that week in November to show you what the market looked liked back then.
NH-NL ratios from :11/14/2005 to 11/18/2005
Monday showed a ratio of 275-130
Tuesday showed a ratio of 152-183
Wednesday showed a ratio of 103-207
Thursday showed a ratio of 297-147
Friday showed a ratio of 415-106
Below is an updated look at the weekly averages for the NH-NL Ratio:
Saturday, October 1, 2005: 255-116
Saturday, October 8, 2005: 197-144
Saturday, October 15, 2005: 46-317
Saturday, October 22, 2005: 73-220
Saturday, October 28, 2005: 111-162
Saturday, November 5, 2005: 241-93
Saturday, November 12, 2005: 231-111
Saturday, November 19, 2005: 248-155
Saturday, December 02, 2005: 312-73
Saturday, December 10, 2005: 309-77
Saturday, December 16, 2005: 293-104
Saturday, January 7, 2006: 473-47
Saturday, January 14, 2006: 500-32
Saturday, January 21, 2006: 348-46
Saturday, January 28, 2006: 516-46
Saturday, February 4, 2006: 449-44
Saturday, February 11, 2006: 229-57
Saturday, February 18, 2006: 306-42
Saturday, February 25, 2006: 420-36
Saturday, March 4, 2006: 399-49
2/11/06 Weekly Screen Quotes:
“A few weeks ago, I held six traditional stock positions and have been forced to sell all but two positions.”
“As I said above, I have been locking in profits and moving to cash.”
“This week, the ratio averaged 229 new highs per day, the weakest number since the week of October 28, 2005 when we had a negative ratio. The new lows gave us the largest average since the week of December 16, 2005 when it was above 100 stocks per day. Above everything else, I turn to the NH-NL ratio to gauge the strength among the leaders and I allow the ratio to help me decide when it’s time to use margin and when it’s time to start moving to cash (and vice versa).”
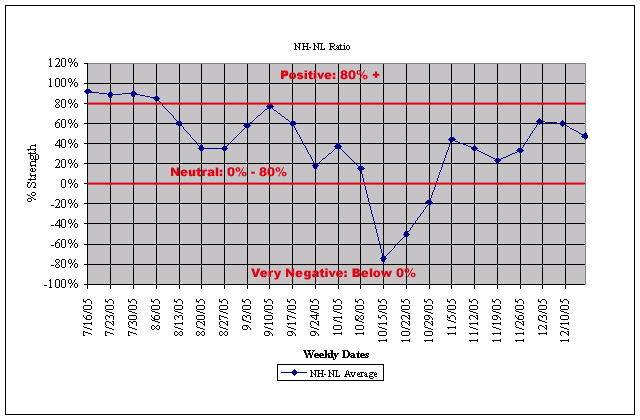
The chart in this blog post shows a graph that highlights the strength and weakness on the NH-NL ratio during the second half of 2005. I will update the graph with the latest data and post it up tomorrow. To calculate the percentage correctly, use this formula: (New Highs – New Lows) / (New Highs + New Lows) * 100 = X%
Piranha
posted by Chris Perruna @ 1:56 PM
2 comments
![]()


2 Comments:
Good post Piranha. Very interesting. In your calculations of new highs or new lows do you calculate based in the dow+nasdaq+amex+otcbb ?? Or only dow+nasdaq+amex ? Do you calculate this info daily or weekly to plot the chart ??
Thanks
Chris
Dow, NASDAQ and AMEX based on IBD information. I follow the NH-NL ratio daily and then plot it weekly to allow me to see the bigger picture (longer term trends). Weekly trends are more important than daily trends when viewing the NH-NL ratio.
Post a Comment
<< Home