General Market Analysis
 Due to our typical mid week special screen, I have uploaded another mini-screen with general market analysis and a few stocks that made noise on Wednesday (a few MSW Index stocks are included).
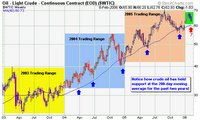
Oil prices fell again ($62.55) but still remain at historical highs. To put today’s prices into perspective, we must look at a multi-year chart to see how inflated the price of crude truly is. In 2003, crude was slightly above $30 a barrel and maintained its price throughout the year to close in the same vicinity in 2004. In early 2005, prices closed slightly above $40 en route to $70 over the next twelve months. Crude has dropped over $6 since the peak in late January which was close to the record highs set in late August. Supplies are up in the United States but many investors and analysts (yes the talking heads) still fear the tensions in Iran and the supply fears out of Nigeria.
So what does all of this mean?
It means that the market and investors are unsure of themselves and their investments with many questions unanswered. Looking at the New High-New Low ratio (NH-NL), we can see the dramatic drop in support of the leading stocks over the past week. The number of new highs for the first three days of this week has dropped 48%, 63% and 66% from the ratio of the first three days of last week. Even though we started last week with ratios of 572, 545 and 571, we ended the week in a decline, closing at 218-55. So far this week, we failed to surpass 200 new highs, two of the three trading days, not a sign of strength. Adding to this analysis is the fact that several stocks have been removed from the MSW Index based on sell rules and the fact that the Index dropped 4.65% earlier in the week.
The NASDAQ did manage to close back above the 50-d m.a. with a 1% gain and did close in the upper half of the day’s trading range (the first positive sign of the week). Cisco Systems posted earnings that topped analyst expectations, lifting the big cap stocks higher. As Investor’s Business Daily noted, recent leaders (AAPL), (HANS) & (GOOG) have fallen along with many of the leading energy stocks over the past few weeks. I know many of you have been locking in gains or cutting losses during this tumultuous environment and I commend you for following the rules. By following the rules, you will save yourself money on all fronts.
A few stocks that made some noise from yesterday:
- STMP – 30.99, a stock we have been following on the daily screen for months. The recent slide to the 50-d m.a. turned out to be an excellent buying opportunity for trend traders.
- EXBD – 102.25, another stock completed the $60-$100 move. The pattern was text book at it hit the $60’s and then corrected for several months before making the true run. The advance took about a year as patient investors were rewarded.
- MLR – 24.50, after the correction from $22, the stock based and is now moving to new highs. The correction lasted for four months and should have shaken out most of the weak holders
- TS – 156.44, up over $8 on volume 125% larger than the 50-d m.a. (the stock is now forming a high handle to the cup shaped base that lasted for four months)
- OXPS – 30.97, up on volume 227% larger than the 50-d m.a. as the stock has setup another double top breakout above $32
- HAL – 74.55, after reaching a 52-week high above $80, the stock has now corrected due to the drop in crude oil. The stock is energy related and has large ties to the Middle East which is at unease with the tension in Iran
Piranha


0 Comments:
Post a Comment
<< Home