
Is the NH-NL Ratio reliable?
 Based from the blog earlier in the week, I have updated the NH-NL ratio chart using the latest figures from the weekly averages. As you can see, the NH-NL ratio has been playing see-saw with the 80% positive/neutral line. With the NH-NL ratio staying below 500 new highs per day, we should not expect the line to travel in positive territory.
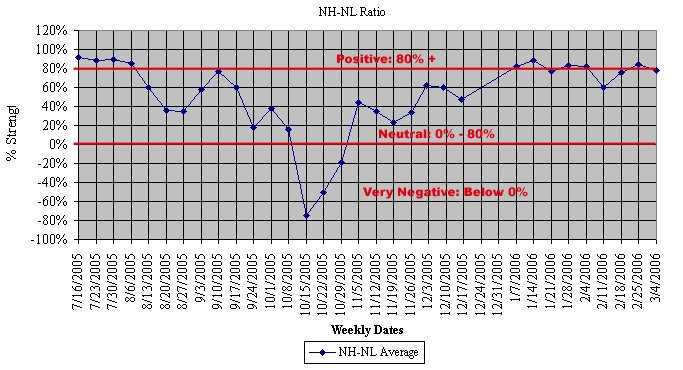
If you are skeptical about the line plotting above the 80% positive level, let me remind you of early 2004 when the NH-NL ratio was still extremely powerful (the end of the 2003 bull run):
January 2004:
1/06/04: 856-11
1/08/04: 966-9
1/09/04: 823-11
Weekly average: 97.5%
1/12/04: 823-11
1/13/04: 684-8
1/14/04: 776-9
1/15/04: 788-5
1/16/04: 889-4
Weekly average: 98%
1/20/04: 1,142-8
1/21/04: 950-3
1/22/04: 846-7
1/23/04: 646-6
Weekly average: 98.5%
1/26/04: 796-7
1/27/04: 724-8
1/28/04: 511-9
1/29/04: 206-10
1/30/04: 286-5
Weekly average: 96%
The ratio started to turn neutral in March 2004 and we saw the first negative NH-NL ratio on April 14, 2004 when it finished at 102-135 (a major red flag). Looking at the chart for the NASDAQ (going back to 2003 and 2004), you can see that this ratio perfectly showed the start of the decline from March to August after the tremendous bull rally of 2003.
Now those are amazing and reliable readings!

Piranha
posted by Chris Perruna @ 6:27 PM
0 comments
![]()


0 Comments:
Post a Comment
<< Home