
Market Reversal?
 With rate hikes across the globe, the markets opened lower but stopped the bleeding around noon and started to construct an afternoon rally. The NASDAQ was down as much as 2.4% and losers were outpacing advances by a 5-to-1 margin but the reversal officially gave the market a day “1” count for an attempted rally. This time I will buy into the possible start of a rally but I will not “jump the gun” until I get a solid follow-through in one or more of the major indexes in the next four to ten days (preferably four to seven days). As IBD states (rules of William O’Neil’s CANSLIM), no major bull market has ever started without a follow-through from the initial day one attempt. I am not saying that this rally will work but I will take this move a bit more seriously than last week because I see many oversold indicators working together. Things can turn on a dime in the market and even though the NH-NL ratio and several individual market leaders got trounced, we can reverse for an attempted up-trend in less than a week. The DOW was up slightly on volume 38% larger than yesterday as the afternoon showed a nice surge in activity.
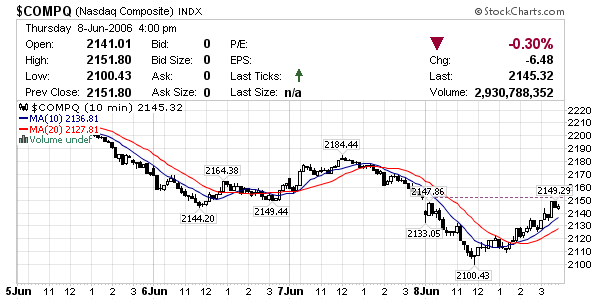 Even though the major indexes made solid reversals with spikes in volume, the NH-NL ratio weakened to its worst level of 2006 (49-371). Typical in 2006, we continue to see contradictory and conflicting data between the major market indexes and the “so-called” individual market leaders.
As you can see, day one of an attempted rally has passed and this is why it is very important to keep watch lists during poor market environments because we may have a buy signal within the next four to ten days.
Take a look at the first chart, it shows the daily reversal on the candlestick chart for the NASDAQ.
The second chart shows the NASDAQ in an intraday view with a nice mid-day reversal and afternoon up-trend with increasing volume.
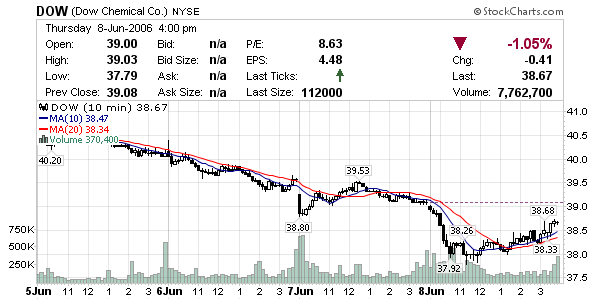
The third chart shows the DOW from an intraday perspective as it mimicked the action among the NASDAQ.
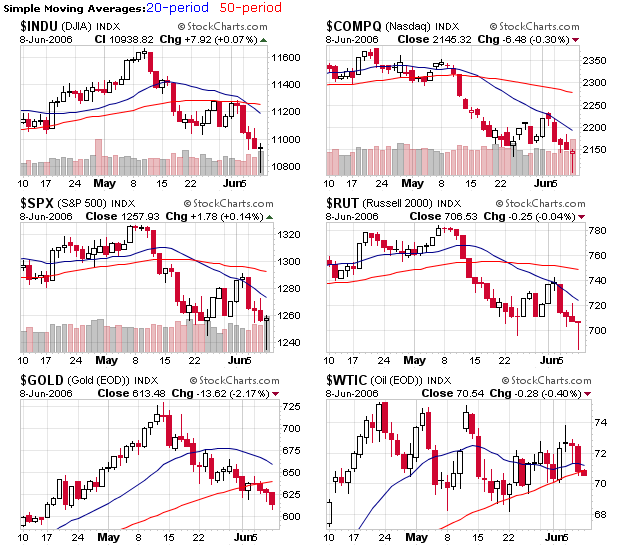
Finally, I show a multitude of index charts that keep everything in perspective and show you that the market is still in a downtrend even though we may have witnessed a reversal.
Piranha
posted by Chris Perruna @ 9:27 PM
0 comments
![]()


0 Comments:
Post a Comment
<< Home