
Can HANS do it Again?
 CASE STUDY – Can HANS do it Again?
HANS – Hansen Natural Corp.
Beverages – Soft Drinks
Company Profile:
Markets, sells and distributes beverage category natural sodas, fruit juices, energy drinks, lemonades and orangeades
Hansen Natural Corporation. The Group's principal activity is to market, sell and distribute beverage category drinks. These include natural sodas, fruit juices, energy drinks, sparkling lemonades and orangeades, non-carbonated ready-to-drink iced teas, lemonades, juice cocktails and energy sports drinks, children's multi-vitamin juice drinks and nutrition bars and cereals. The Group also markets and distributes energy drinks under the Monster(TM) brand name. In addition, it markets nutrition bars and cereals under the Hansen's(R) brand name. Its fruit juices for toddlers and malt-based drinks are marketed under the Junior Juice(R) and the Hard e(TM) brand names. The Group's operations are conducted through wholly owned subsidiaries Hansen Beverage Company ('HBC') and Hard Energy Beverage Company ('HEB'). The customers of the Group include, Costco, Trader Joe's, Sam's Club, Vons, Ralph's, Wal-Mart, Safeway and Albertson's. - Profile provided by Ameritrade.
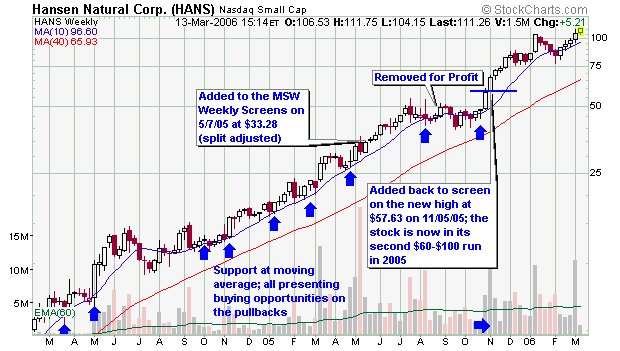
Hansen first entered my life a as $60-$100 candidate back in May 2005 before the most recent split adjustment. Using the non-split adjusted price of $66.56, HANS quickly moved through the infamous range within two months. After consolidating for another two months, I sold my shares and also removed it from the MSW Index. The consolidation period went on to form for a total of four months as the stock split 2-for-1.
After the stock split, HANS broke out once again towards the $60 range and I jumped back in and started coverage on the MSW index for the second time in one year. This time, the stock bolted from $60 to $80 in six weeks and then traded sideways for five weeks before breaking out once again and completing another $60-$100 range. A quick reversal from $100 forced me to take profits and eventually remove it from the MSW Index in January 2006. I also sold these shares due to the weakening market as told by the NH-NL ratio and the individual leaders (HANS being one of them).
Recently, the stock has been forming yet another base (8 weeks) while holding the long term moving averages. HANS broke out to a new high last week and we screened it on our daily charts and have it sitting on our weekly honorable mention list (looking for a new entry area before adding it back to the MSW Index). I have not bought back into HANS for a third time but I am looking for the opportunity. Without using the split adjusted price, I have bought shares at $66.56 and $115.26 (now I am looking to place a new position above $200 per share).
Stocks that make new highs typically continue to make additional new highs unless the trend changes! The trend hasn’t changed for this stock YET! Let’s take a look at the financials that have fueled this all-star stock over the past two years. Remember, I bought at $66 after the run-up from $15 to $60.
Sister Stocks:
Glacier Water Services – GWSV
Jones Soda – JSDA
Leading Brands – LBIX
National Beverage - FIZ
Key Ratings:
Overall Rating in IBD: A+
EPS Rating: 99
Relative Price: 99
Industry Group Rank: 41 (of 197)
3-Year EPS Rate: 178%
3-Year Sales Rate: 58%
ROE: 68%
PEG: 1.53
EPS Analysis (yearly):
2001: 0.14
2002: 0.14
2003: 0.28
2004: 0.87
2005: 2.59
2006: 3.64 (E)
2007: 4.49 (E)
EPS Analysis (quarterly):
Q1 (2004): 0.09
Q2 (2004): 0.22
Q3 (2004): 0.25
Q4 (2004): 0.31
Q1 (2005): 0.37
Q2 (2005): 0.31
Q3 (2005): 0.83
Q4 (2005): 0.75
Revenue: (in millions)
2001: 92.28
2002: 92.05
2003: 110.3
2004: 180.3
2005: 348.9
Net Income: (in millions)
2002: 3.03
2003: 5.93
2004: 20.4
Pretax Income (in millions):
2002: 5.07
2003: 9.76
2004: 33.9
Total Assets (in millions):
2002: 40.5
2003: 48.0
2004: 82.0
Key Stats in 2005:
Annual 2005 EPS: $2.59 vs. $0.87
Q1 EPS: $0.73 vs. $0.19 (not split adjusted)
Q2 EPS: $0.63 vs. $0.22 (not split adjusted)
Q3 EPS: $0.83 vs. $0.24
Q4 EPS: $0.75 vs. $0.31
Number of Institutions (last reporting period):
% Shares held by Institutions: 49%
Total Institutions: 383
Money Market: 175
Mutual Funds: 200
Other: 8
New Positions Bought: 113
Existing Positions Sold: 37
Top Mutual Fund Holder: Fidelity Low-priced Stock Fund (1.5 mil shares)
Piranha
posted by Chris Perruna @ 5:16 PM
0 comments
![]()


0 Comments:
Post a Comment
<< Home