Reviewing the Market Charts
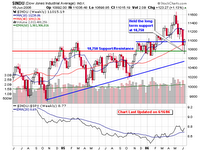
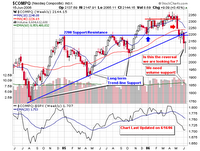
 The DOW was back above 11,000 with a 1.8% gain on volume that was close to yesterday’s average while the NASDAQ was up 2.8% on volume 6% larger than yesterday. Advancers led decliners by a 4-to-1 ratio on the NASDAQ as many familiar stocks joined the party.
 This was the best gain for the NASDAQ since March 25, 2004, well before the official start of MSW, although I was running these screens on several internet forums. It was also the first back-to-back triple digit gain for the DOW in 18 months as all 30 DOW stocks ended higher (not that we follow these blue chips).
 The S&P 500 gained 26.12 points for its best one day gain since Mach 17, 2003 when it gained just under 30 points. The gains were solid but the volume was lacking for an all-out accumulation day as the NH-NL ratio finally subsided a bit with a final tally of 57-124 (still negative but looks much better than the past week).
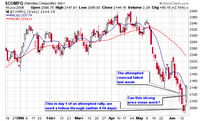
 If you are wondering about a rally, today was the second day of a newly attempted rally with a follow-through targeted for Monday thru Friday of next week. The rally count reset after we hit a new low, lower than the previous rally attempt. I told you that July was the only bullish month of the summer so I wouldn’t be surprised to see a move heading into next month. Don’t jump in early but start to review the stocks on the daily screens and look for candidates that consistently show up every night. I am doing the same and looking to start with a fresh batch of stocks for the MSW Index.
 This next chart is one that is used by Trader Mike, a trader I have spoken about in the past, who I respect. It is the % of stocks above their 50-day moving average (it gauges the strength among the individual stocks on the index). I have never used this indicator but it seems very interesting so I will post it here for the first time. From what I understand, 20 and 80 are the extreme levels that can and sometimes do give buy and sell signals. For now, I will start to view it as a secondary indicator with relation to the NH-NL ratio I use. I would like to observe it for myself for a period of time before influencing decisions based on the action of the chart.
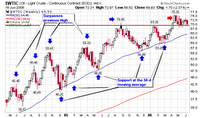
 Finally, crude oil is still above the support area of $70 and until this breaks, I don’t see any major bull markets in the near future. Just an opinion of mine (I do understand that opinions are worthless in the market)!
Piranha


0 Comments:
Post a Comment
<< Home