Déjà vu on the NASDAQ?
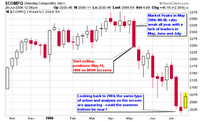
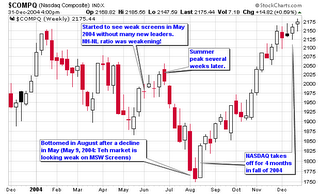
 As I was researching my archives on MSW (the archives from 2004 and 2005 are open to everyone) I found some interesting data that correlates the NASDAQ in 2004 and 2006. So far in 2006, we have had 15 down weeks and 14 up weeks. At this time in 2004, we had 19 down weeks and 10 up weeks and the NASDAQ was at a nine month low (very similar to now as we are near 10 month lows). In 2004, my daily and weekly screens started to turn south on May 9th; in 2006, they started to turn south on May 15th (about the same time).
If you look at the two charts presented in this blog entry, you will notice how the market started to weaken in May and June and with a bottom near the end of July into early August. This summer is not over but I am wondering if the pattern will turn out to be similar to the one from 2004. The old saying: “sell in May and go away” has held up over the past couple of years with opportunities presenting themselves during the fall (towards the end of October).
Several of things I was saying back in 2004 are very similar to what I have been saying over the past two months. The similarities are amazing and the current NASDAQ chart may be forming a pattern that could take a similar route as it did in August of 2004. Only time will tell but history repeats and traders are always learning from history.

NOTE: when I say history repeats; I am not saying that it repeats exactly but the charts do resemble similar formations and seasoned traders and investors can capitalize on these situations.
Here is my exact analysis from July 2004, very similar to things I am saying today (2 years later).
“WEEKLY OVERVIEW of 7/19/04 to 7/23/04:
I am starting to sound like a broken record. The Dow was down for the 5th consecutive week. The NASDAQ is now at a nine month low.
Quote from IBD regarding the NASDAQ:
“Out of 29 weeks of trade this year, excluding the week ended Jan. 2, 19 have been down.”
I ran my screens this past week with a few stocks making some daily cut offs – barely. When I ran my final weekly screens last night, I came up empty. Not one possible candidate that legitimately makes my watch list. I must scratch my head when I see people listing dozens of stocks for potential buys in this type of environment.
Anyway, I have my own system and that is all I can talk about right now and this system is telling me to be patient, be very patient. Every red flag has been raised over the past 3-4 months.
Anyone that has followed my screens would have noticed that things were going south when I stopped posting individual stock lists after May 9th. How could I, quality stocks were not around. I would be doing an injustice to the people that follow my screens if I just posted any old crap for the sake of posting.
Now, let’s be patient – patience is one of the most sacred virtues of a stock market investor. Jesse Livermore once said: “It’s not your thinking that makes you money, it’s your sitting”.
Here are some insight about market corrections:
Market corrections are healthy, allowing it to breathe. Corrections allow stocks to shake out weak holders and allow stocks to form proper bases. Corrections allow stocks to resemble their actual value more closely. Market corrections and flat markets allow intelligent investors to study conditions carefully while they sit on the sideline patiently awaiting the defining trend. Money is made on the big moves, not the minor day to day moves. Corrections allow big moves to establish themselves.
During bear markets or general market corrections, it is essential to keep up your watch list as many future high flyers are building bases during these times. Stocks that correct the least and sport the highest relative strength lines tend to be the leaders of the next bull market. Take note of all stocks that are base building during corrections, a cup with handle or flat base are the most popular.
How can you spot a correction or bear market on the horizon
• The major indexes will advance on below average volume.
• Stocks making new 52-week highs will be limited.
• Stocks making new lows will increase.
• Major indexes will fall below the 50-day MA and/or the 200-day MA.
• Index averages will start to under perform. Relative strength lines will head south.
• Major publications will tout hot stocks at key market reversals (market tops).
• Smart money will bail in huge volume. Down days on excessive volume above average.
NO STOCKS LISTED THIS WEEK, REFER TO PREVIOUS WEEKS”
-7/26/04
Just a note: I didn’t add any new stocks to the MSW index last week (7/26/06)!
Piranha
Labels: General Market


1 Comments:
I just wanted to complement you on the great job you are doing with this blog. Keep up the good work.
Dan
Post a Comment
<< Home