Test Buys are starting to Pull-Back
 Even though I have placed several test buys over the past few weeks, I am starting to see some of the breakouts pullback and possibly breakdown. I will not hesitate to cut these positions and move back to cash as this rally may be a false move especially since it confirmed well after the seventh day (original CANSLIM rules).
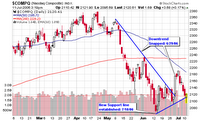
 We’ve logged two consecutive negative days for the NH-NL ratio and are on target for a third today. Looking at the NASDAQ daily chart, we can see that the index has formed a new short term up-trending support line with today qualifying as the third touch. We slipped below the line intraday (briefly) but have managed to pull back above the line (slightly) in late afternoon trading.
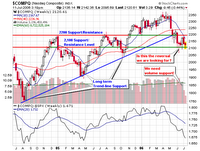
 Looking at the NASDAQ weekly chart, we see that the longer term trend is holding support above 2,100 for the past seven weeks as a new range is starting to form between 2,100 and 2,200 (below both major moving averages). Relative strength for the NASDAQ has dipped to a new 52-week low as seen on the weekly chart.
 The S&P 500 and DOW are trading near recent support levels but are struggling to climb above their respective 50-d moving averages. The S&P 500 is holding the 1,245 support level and is still above the up-trending support line dating back to 2004 but the short term outlook is not anything to write home about.
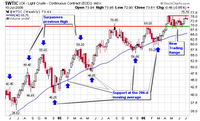
 Finally, looking at crude oil, we can see that a 13-week trading range has developed between $70 and $76 with both numbers acting as support and resistance. I am still looking for a break below $70 in order for the market to gain a sustainable rally but it is not happening. Even if crude breaks the current trading range, I see the longer term moving average (40-week or 200-day) giving support lower as it has over the past several years.
We will need to continue to grind out small gains based on quick movements as the longer term trends are still sideways with volatile swings from month to month.
Piranha


1 Comments:
For this particular post, I am talking about realizing the small gains of the past several weeks as the market breaks-down. We know things are turning, so capture the gains before they become small losses. My sell stops were tight with a maximum of 7% on a stock such as GRMN but I am taking the profits before they become losses as I see the market heading lower. Call it an observational sell stop.
Post a Comment
<< Home