
MSW Market Overview
This post contains a portion of the general analysis from the MarketStockWatch.com Weekly Screen: 7/10/2006 to 7/14/2006
Said on last week’s Weekly Screen Analysis (7/8/06):
“I still have doubt in my mind about this rally because it didn’t confirm within seven days.”
 I want to start by stressing the importance of paying attention to the overall market (a statement I made to start last week’s analysis). If the market starts to pullback, so will the majority of stocks (another repeat statement). It will be very important to watch the leading stocks to see how they react to any corrections and/or pullbacks (a third statement from last week – this statement told us to sell test positions turning against us as noted on the daily screen on Wednesday and Thursday). So what do we do and how can we gauge what’s going on in the market?
I am looking for stocks that are holding up better than the major indexes. Stocks that fall less than the overall averages is a good place to start. My first list to check is the MSW Index, then the MSW watch list and finally I will search the daily screens and overall market for stocks that look like leaders based on their recent relative strength (when I say recent, I mean the past 5-8 trading days).
To start; how much did the major indexes fall?
NASDAQ: -4.4%
DOW: -3.2%
NYSE: -2.5
S&P 500: -2.3
Looking at the MSW Index, we see that every stock fell for the week, so which ones dropped the least?
GRMN: -1.75%
TS: -2.71%
These were the only qualifying stocks from the MSW Index that fell less than the major indexes. Garmin (GRMN) fell less than every major market index and found support near $95 and the 50-day moving average. It did qualify for distribution, the first in 13 full weeks. TS was strong but the stock has formed a trend line that is pointing down (I will add this trend line to the weekly chart; it can be seen best on the daily chart).
Looking at the MSW Watch list from last week, we see one solid stock:
KNOT: -1.29% (down less than the major averages)
With this in mind, we see that only two stocks maintained their leadership status based on this analysis but several of them are still above key support levels and will remain on the MSW Index because they are still better than most of the options out there. Only two stocks on the MSW Index contain RS ratings less than 90 (CME and ADVS with 89 and 88 respectively). Only one stock from the watch list last week currently holds a RS rating less than 90 (BLKB with an 86 – no longer listed).
Last week I said this: “Although the ratio turned positive, we ended on a sour note with the only negative daily reading of the week on Friday. We had our fewest new highs of the week and our most new lows for one day of action. Sprinkle in the fact that both the DOW and the NASDAQ fell 1.2% on slightly higher volume and we can start to become concerned if we have open positions.”
The foreshadowing was written on the wall with new lows expanding as the week wore on. We logged another negative NH-NL ratio with the weakest rating since the week ending June 17, 2006. We also witnessed the second most new lows logged in one week for the entire year of 2006 with only June 17 higher with 310 (the only week above 300 since October 15, 2005). With the market breaking down and the NH-NL ratio confirming, we are in some serious trouble. I have closed my test buys and moved back to cash (except for several long term option positions) and I advise that you all take serious looks at any stocks you may currently own. The sharp reversal in the market was not a surprise and I was not hurt much at all since I was only placing positions about 1/3rd my typical position size. This is the exact reason why I place test buys; all indicators weren’t in sync (specifically the NH-NL ratio).
Follow our three most important Indicators:
1. The price and volume of the major indexes
2. The action on the NH-NL ratio
3. The action among leading individual stocks
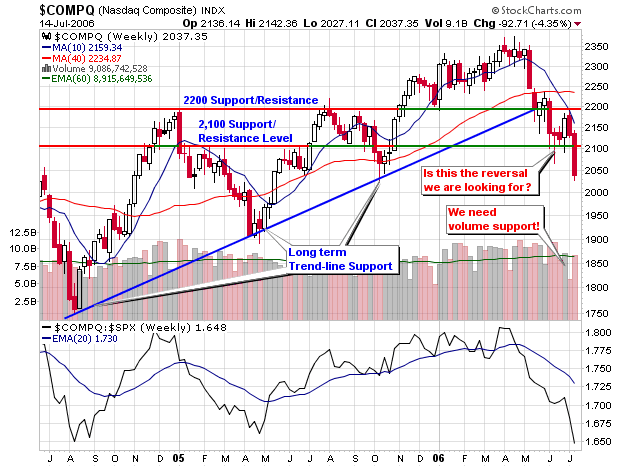
 As we already know, all three indicators are extremely weak and all three indicators are heading down! The NASDAQ is at a nine month low and has violated all recent support; starting with 2,200, then 2,100 and then 2,050. The relative strength rating is at multi-year lows and is pointing straight down (a very steep drop over the past two months). The next low would be near 1,900 which was set back in April 2005. Looking at the retracement levels, we see that the NASDAQ has violated the 61.8% level of 2,178, the 50% level of 2,125 and the 38.2% which sits at 2,071.9. Based on all the information at hand, I would expect some type of bounce on Monday but that’s not a given especially since the Trader’s Almanac states that most Mondays are down after a negative Friday. We are definitely in a correction because the NASDAQ is down 14.2% since its 52-week high and 7.6% since January 1, 2006.
The DOW and S&P 500 have also violated all support levels but are in much better shape than the NASDAQ. The S&P 500 is only down 1% for the year and 6.8% since its 52-week high. I tend to rely on the NASDAQ more so than the DOW but it is interesting to see that large caps are gaining some steam while small caps are getting trounced. I have two charts posted on page two of my charts link that show the transfer of strength going from small caps to larger caps.
 The larger story lies with crude oil as it hit an intra-week high of $79.86 while closing at $78.71. Crude showed a large intraday reversal on Friday but still closed with a slight gain for the day. It broke out above the $75 resistance this week and was helped by the tensions in the Middle East and growing tensions with Korea. As long as missiles are being fired in the Middle East (outside of Iraq), crude and gold will travel higher while stocks struggle to hold their ground.
Gold reached a low near $550 but has now retraced about 62% and is trading back within the channel lines that date to 2005. Using retracement level logic, we would think that gold would pullback at this time but world tensions may change the formula and change human psychology.

All in all, we had a very negative week and I have no idea what next week will bring but I do know that I can’t lose much money because I don’t have much of it risked at this point in time. With that in mind, I am able to sleep at night without worrying if my account will be slaughtered tomorrow or the next day. I have moved portions of my cash to alternate investments while the market is taking its sweet old time to rally higher and urge you all to speak with your accountants and/or financial planners to do the same. These are not high interest investments but slightly better than the basic money market rates available. I have also been researching housing prices here in NJ because I know that the big builders are having trouble selling their back-log of homes. It’s still early in my opinion but I look to purchase several properties over the next few years to build an additional investment patch and/or income stream (this idea is still in the works).
Below is an updated look at the weekly averages for the NH-NL Ratio:
Saturday, January 14, 2006: 500-32
Saturday, January 21, 2006: 348-46
Saturday, January 28, 2006: 516-46
Saturday, February 4, 2006: 449-44
Saturday, February 11, 2006: 229-57
Saturday, February 18, 2006: 306-42
Saturday, February 25, 2006: 420-36
Saturday, March 04, 2006: 399-49
Saturday, March 11, 2006: 162-84
Saturday, March 18, 2006: 459-53
Saturday, March 25, 2006: 312-52
Saturday, April 01, 2006: 441-39
Saturday, April 08, 2006: 481-58
Saturday, April 15, 2006: 150-103
Saturday, April 22, 2006: 540-75
Saturday, April 29, 2006: 353-76
Saturday, May 6, 2006: 503-74
Saturday, May 13, 2006: 384-116
Saturday, May 20, 2006: 64-211
Saturday, May 27, 2006: 57-182
Saturday, June 3, 2006: 119-93
Saturday, June 10, 2006: 72-204
Saturday, June 17, 2006: 41-310
Saturday, June 24, 2006: 56-238
Saturday, July 01, 2006: 127-198
Saturday, July 08, 2006: 143-95
Saturday, July 15, 2006: 74-273 - This Week
As for new highs vs. new lows – here are the facts:
Monday showed a ratio of 102-147
Tuesday showed a ratio of 99-193
Wednesday showed a ratio of 90-185
Thursday showed a ratio of 43-386
Friday showed a ratio of 34-455
Piranha
Labels: General Market
posted by Chris Perruna @ 8:34 AM
0 comments
![]()


0 Comments:
Post a Comment
<< Home