
Discovering the TICKS
 I was reading through Trader Mike’s blog Wednesday night and came across a very interesting indicator that can be studied on a chart. In his post, Review of “Mastering the Trade” by John Carter, I was reminded about an indicator I have seen on several occasions but have never taken the time to research because I am not a day trader (yet).
Before going further; have you ever been in a situation where you see or hear something once but pay no attention, see it a second time and possibly take a deeper look but then see it a third time and really jump into the concept. I first heard about the indicator TICK or $TICK on stockcharts.com when reading through SFO magazine. I don’t remember the author’s name but I will assume it was John Carter and will take a look later this morning as I save every edition of SFO. The second time I saw TICK was during my 4th of July vacation while reading Martin Schwartz’s Pit Bull as he explained how the indicator is a must for his system. Schwartz said exactly what John Carter’s article states about the levels of TICK so I must assume that many great traders use this indicator. Wednesday was the third time I came across this indicator and the second time in one month so it must be something that my subconscious wants me to look into further (yes, I believe in the subconscious and the idea that the proper tools are presented to a student when they are ready for them). I hope that doesn’t scare anyone away but read Napoleon Hill or watch The Secret and you will understand where I am coming from.
What is a TICK?
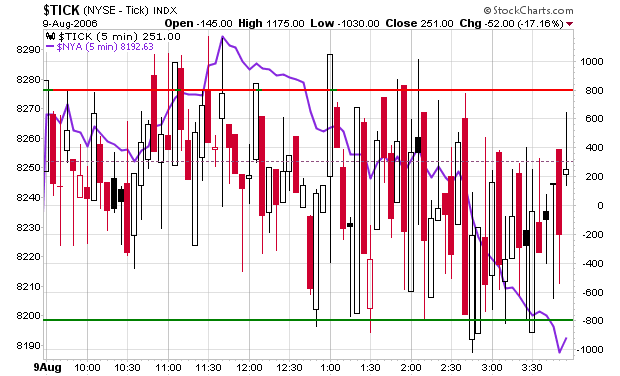
The TICKS ($TICK for NYSE or $TICKQ for NASDAQ) summarize the number of stocks on the NYSE that are increasing in price versus those that are decreasing in price from the previous price quote.
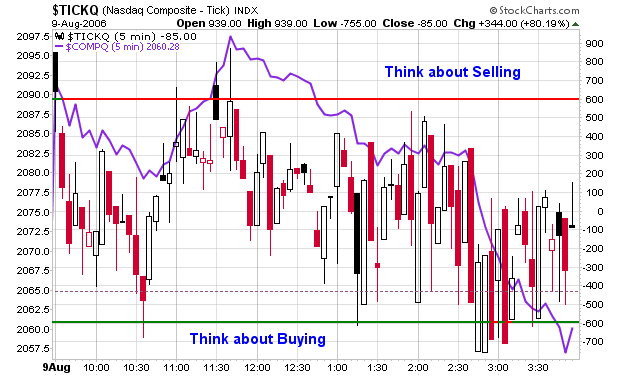
Anyway, after reading the blog post and then re-reading John Carter’s article, I started to play with the chart and overlay market information. What was really interesting was the $TICKQ which represents the NASDAQ and how it predicted the top in the market today. While doing my research tonight, I realized that the NASDAQ peaked just before noon (approximately 11:45am) and then headed down for the day. This happened at the exact same time that the $TICKQ reached an intraday high above +800 and then reversed during the 5-minute candlestick. The actual candlestick closed below +600 for the timeframe and then quickly dropped by 50% over the next five minutes which should have told day traders that the market was turning down with heavy selling pressure.
Looking at the chart posted in the blog entry, you can see how the purple line (representing the price of the NASDAQ) topped at the peak of the $TICKQ and then went south for the remainder of the afternoon. The indicator attempted to cross above +500 a few times during the afternoon but was quickly turned sideways or in the opposite direction, confirming the weakness and selling pressure. By 2:30, the indicator was staring to violate -600 and the NASDAQ was reaching intraday lows as most stocks were starting to turn from green to red on my computer screen.
I admit that I don’t know much about this indicator and only started to research it today but I can already see its power and understand how it may help me with my current and future trading systems. I understand charts and this chart was amazingly accurate today so it has caught my interest. I was already interested when great traders such as Martin Schwartz consider it a must and then it is confirmed by John Carter in SFO and then one of my favorite stock bloggers in Trader Mike. I read about indicators and oscillators every day but I toss most of them aside because they have no value to me at this time with my current trading style but I knew within minutes of studying my charts today that this indicator will be added to my arsenal. As I continue to study the indicator and eventually use it with my trading, I will report back on this blog if it has helped or hindered or has done nothing at all.
Piranha
posted by Chris Perruna @ 11:35 PM
1 comments
![]()


1 Comments:
You should check out how Dr. Brett uses it too. He tracks "adjusted TICK" and uses it for more than just daytrading (I think). HE has some articles about it here http://www.brettsteenbarger.com/articles.htm
Post a Comment
<< Home