
Interesting Stocks to Watch
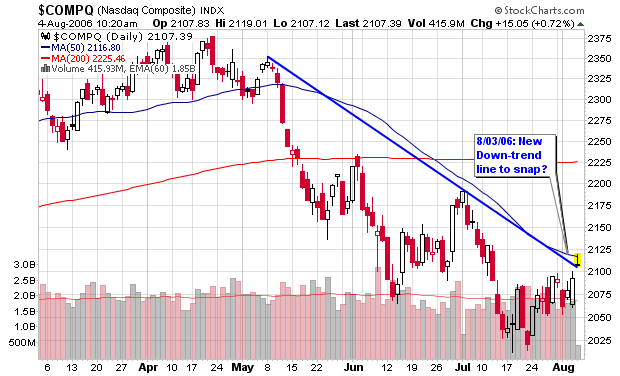 The NASDAQ is trading near the 50-day moving average today and has actually pushed above the down-trend line placed on my chart. If the index can follow through and close above both the moving average and the trend line, I consider this a successful week. I voted neutral on the latest Ticker Sense Blogger Sentiment Poll after voting negative the past couple of weeks (I hate to be on the fence but I am). If the NASDAQ can trade above these areas and the NH-NL ratio can continue to stay positive, I will start to get more of a positive feel for the overall health of the market.
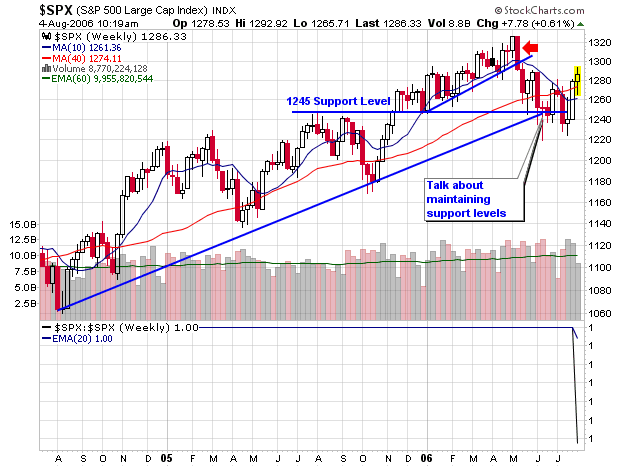
The S&P 500 is forming a cup shaped pattern and has overtaken the 50-d and 200-d moving averages and has moved higher in above average volume the past three weeks. Earlier this week, we had our strongest daily NH-NL ratio in months which tells me that some institutional buying is taking place as the summer heads down the home stretch. In any event, don’t rush to buy stocks on the long side until we get a market breakout and a strong weekly confirmation with the NH-NL ratio. Another important aspect to the market possibly gaining strength will be the health among the individual market leaders. Until they can gain their footing and move higher with volume support, we can continue to be skeptics (protecting our capital).
Below are a few stocks that interest me at this time along with a couple of lists highlighting the action from Thursday’s market (similar to a typical daily screen I run each night).
Some Interesting Stocks to Watch:
- CELG – 46.95, a move above $50 is a buy signal on the P&F chart as the stock has a strong long term trend above the 200-d m.a. (since February 2005)
- GILD – 62.07, buying above the moving averages as the stocks qualifies for a possible $60-$100 run
- BOT – 127.06, a stock I profiled earlier in the year on this blog that actually corrected but is now challenging all-time highs. I am slightly skeptical of the long term move but the trend has been higher for the past couple of months (especially since it recovered the 50-d m.a. near $105 in June
- EZPW – 38.82, could this be the handle formation to the 15-week cup shaped pattern? A move to new highs is very positive especially if volume increased above average
- CMI – 119.28, up and down as buyers and seller struggle to take control of the direction of this stock. Buyers have a slight advantage at this point in time
- TWGP – 29.37, trading in a consolidation range between $26 and $32. A buy happens above $32 with a triple top breakout on the P&F chart
- AB – 66.04, the MSW Index stock continues to make the 200-d m.a. play successful as it also qualifies for a possible $60-$100 run
A Few Interesting Stocks making New Highs Thursday (8/3/06):
- OMX – 44.42, first double top breakout yesterday above $44, another will qualify above $45 as a spread point and figure breakout
- GES – 48.41, a 14% breakout above $47 this week with Thursday’s gain coming on volume 282% larger than the 50-d m.a. (50-day moving average)
- CTSH – 70.31, a solid 10% move this week to breakout above $70 on above average volume (RSI line at all-time high)
- EME – 54.26, the 200-d moving average play has now gained 22% over the past two weeks. Do not chase at this point but keep an eye open for a future consolidation
A Few Interesting Stocks within 15% of a New High (Thursday’s Market – 8/3/06):
- ANSS - 50.39, a strong rebound with support at the 200-d m.a. Volume was up over 219% yesterday, signifying institutional buying power
- NEU - 53.97, an MSW Index stock forming a nice basing pattern with a possible $60-$100 run in the future.
- GIL - 47.32, another 200-d m.a. play with solid support from institutions as volume was up more than 280% on Thursday
- PSA - 83.40, a 21-week cup shaped pattern with heavier buying over the past week or so. I prefer to see a handle form before takeoff so be careful with any entries in this area.
- PVA - 71.28, the daily chart is somewhat sloppy but the weekly chart shows support at the 200-d m.a., a support line it has held over the past couple of years
- TRMB - 49.05, reaching a new 52-week high in the early morning hours of trading on Friday (slightly extended from the major moving averages but it is gaining momentum)
- PZZA - 33.95, I don’t like their pizza but the stock is gaining support at the 200-d m.a. in the midst of an eight month consolidation. Breakout to new highs is an entry signal (above $36 on the P&F chart)
Piranha
posted by Chris Perruna @ 12:00 PM
0 comments
![]()


0 Comments:
Post a Comment
<< Home