
Can the NASDAQ – Crude Oil Index predict Bulls & Bears
 As many of you know, I have had a lot of time on my hands as the market has been trading in volatile patterns with a downward bias. The majority of my money has been parked on the sideline since mid-May with the exception of a few open option contracts (longer term plays). I have not made a trade in five weeks since the start of my vacation in late May and I have become very bored. It’s been tough writing nightly market analysis but I am doing my best to locate possible short setups, consistently monitor the mechanical screen and follow the few market leaders (I prefer to call them stocks with the best RS ratings and charts as no true leaders exist right now).
Using this free time, I have been comparing certain market indexes with other benchmarks that I have been following over the past 6-12 months. Two of these include the NASDAQ and crude oil (light contracts). Two charts are loaded to this blog post:
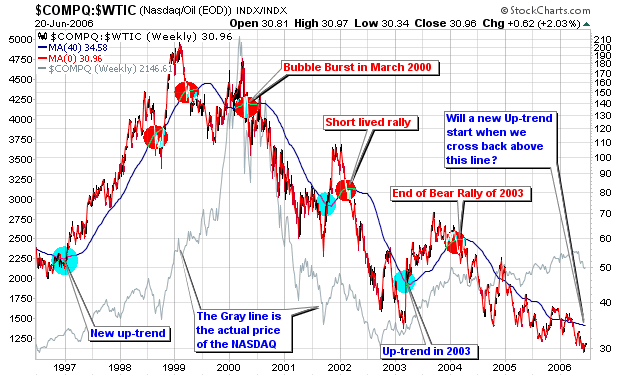
- The first chart is a combination index that I created myself using Stockcharts.com advanced tools. It combines the average close of both the NASDAQ and crude oil contracts over the past 10 years with a 200-d moving average. As you can see, the progression of this chart has called every major up-trend and downtrend before it was about to happen. The gray line on the chart represents the actual close of the NASDAQ index over the past 10 years (this line varies from the combo index). The only major divergence between the combo index I created and the actual price of the NASDAQ is during the past 18 months (since crude has gone wild). The combo index continues to trade downward as the NASDAQ trades sideways to slightly upward.
- The second chart compares the action among the NASDAQ and crude oil over the past 10 years without any special combination effect. As you can see here, both entities have been trending higher over the past 18 months. This is very different from the combo index in the first chart.
So how would I use this combo index?
It is a long term outlook index that seems qualified and prepared to call the next major up-trend for the NASDAQ. To do this, the combo line must cross back above the 200-d moving average with strength and consistency. It has not stayed above the 200-d m.a. for long periods of time since 2003, the most recent “up-trending bullish market”. Prior to 2003, we have not seen a true bull market up-trend with this combo index above the 200-d m.a. since 1997-1999. From mid 2000 on, the combo index has spent much of its time below the 200-d m.a. and we all know how the market has behaved since March 2000.
So, to answer a question I received about a recent comment on a blog post: yes, I do believe that crude oil must cool off before we can sustain a major bull rally and this combo index may prove my theory correct if it continues to trade accordingly. But then again, it is only a theory and I am not into predictions.
Enjoy the combo index.

posted by Chris Perruna @ 2:05 PM
1 comments
![]()


1 Comments:
very interesting chart, i didn't know i could that with stockcharts
nice work
Post a Comment
<< Home