Possible Short Setups
I will start by saying that I am not a professional "day" trader but I am looking to move in that direction and will start to test out my skills with basic technical analysis setups. I figured I would start with the first setup explained in John Carter’s book, Mastering the Trade; see my post from Monday.
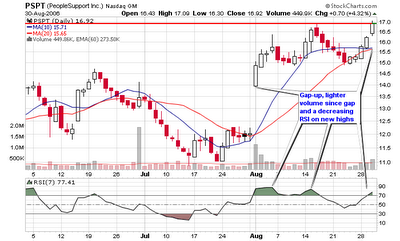
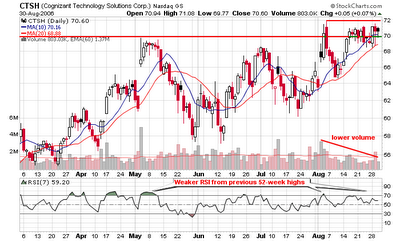
I am posting up four charts of stocks making new 52-week highs but have made these highs on lighter volume and with a weaker RSI. The RSI is actually making lower highs as the stock moves to higher highs which creates a bearish divergence.
Comment on my charts and give me your thoughts. I will disclose that I have already established a position in at least one stock and may establish another position today. The name of the stock is not important as I am just testing some strategies.
Click the charts to enlarge them!


Enjoy,
Piranha


4 Comments:
Chris,
Don't you think the weak RSI is due to the usual low summer volume? Take a look at the http://stockcharts.com/h-sc/ui# #INDU or the SPY, you'll see lower volume at the end of August.
I think you should be scanning for stocks with less than the market's RSI, (SPY's is 66) so less than 50-40 would be good.
Yaser,
That's a great observation. Will consider!
Whether you are successful in your trade will depend on stock selection. Some of the stock you have selected have recent good earnings and if you try and short them based on such indicators you will be in big trouble. Also look at float on stocks you listed. Some of them have low float which again will land you in big trouble.
Yaser,
See my latest post (9/12/06) as a couple of these worked nicely! I wasn't looking for long term moves, only a short term trade.
Post a Comment
<< Home