
Ten Stocks under $10
 I’ve had several requests to do a special screen that locates interesting stocks under $10. As you know, I am not a big fan of stocks trading below $10 but I will perform a screen with this criteria about three or four times per year (to feed the craving).
Humans and their psychological minds love to dream about picking that one big winner from a low place and then ride it to riches. It does happen but not very often so don’t build your trading system from this type of thinking.
The last big winner on MSW from the sub $10 area was Forward Industries (FORD) in 2005 but this stock has since turned into a short in 2006. FORD etched the classic chart pattern that Stan Weinstein talked about in his excellent book Secrets For Profiting in Bull and Bear Markets (stage 1, stage 2, stage 3 and stage 4 bases). Actually, I think I will save this chart and add it to my technical analysis page on MSW as the “textbook” example of a four stage Stan Weinstein pattern.
Now, let’s have some fun and screen some stocks below $10 that present potential opportunities for those of you that can stomach buying these candidates. The stocks below do have decent relative strength ratings and earnings per share ratings.
Interesting Stocks under $10 – A screen for Fun:
*All prices from the close on 8/17/06
- NXG – 3.86, catching support near the 50-d m.a. as it trades in a range between $3 and $4 over the past 14 weeks.
- SLW – 9.45, the young stock is catching support at its new 200-d m.a. as it starts to build momentum to test all-time highs above $12. A move above $12 shows strength.
- JSDA - 7.80, risky as it tests its 200-d m.a. The sister stock of HANS may have downward pressure if Hansen Natural continues to stumble below its 200-d m.a. Stocks move in packs so be wary if HANS breaks down further
- Q - 8.59, nice strength with confirming volume over the past couple of weeks as the stock continues to tread higher. It has a long history of higher prices so it could be a longer term winner.
- STKL - 8.53, the stock advanced more than 100% earlier in the year and is now correcting but the interesting thing I notice on the chart is the decrease in volume while consolidating the former gains. Support at the 200-d m.a. may provide a nice opportunity but wait for the move (don’t enter early)
- GNA - 9.58, a trading range has developed between $8 and $11 but the most recent high in July could not surpass the prior high from April which is typically negative. A move above $11 would grab my attention.
- NSSC - 9.65, seems to be catching support at the 200-d m.a. with a trading range between $8 and $12. It must move above $12 to prove the potential advance.
- DTLK - 9.13, the stock is EXTENDED at current prices but it can become a buy opportunity if it falls back towards the 200-d m.a. and catches support. I wouldn’t consider a position until it at least pulls back to the 50-d m.a. just above $7 and fills the gap from last month.
- GIGM - 8.58, building a 14-week base with support near $7 and resistance at $11. A double top breakout will confirm on the point and figure chart above $10.50 and a new high above $11.
- CUP – 4.22, low priced risky stock that is looking to catch some support near $4 and the area above the 200-d m.a. With stocks gaining strength, commodity related stocks are declining but if Gold regained its footing, Peru Copper could continue the advance from its 2005 IPO. The original pivot point breakout in May was above $4.05 so look for the stock to hold this area.
I wanted to screen one last stock for pure fun: MSW
MSW – 10.79, Mission West Properties is above $10 but only slightly. I don’t know much about this company but it is gaining some strength near the 200-d m.a. as it consolidated from the prior run earlier in the year. The stock has not trended much over the past several years but I thought it would be fun to check the chart.
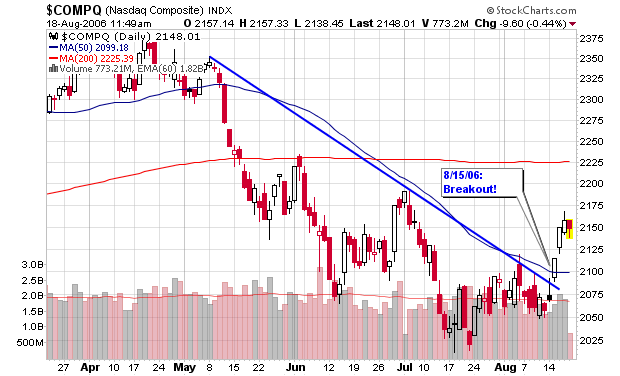
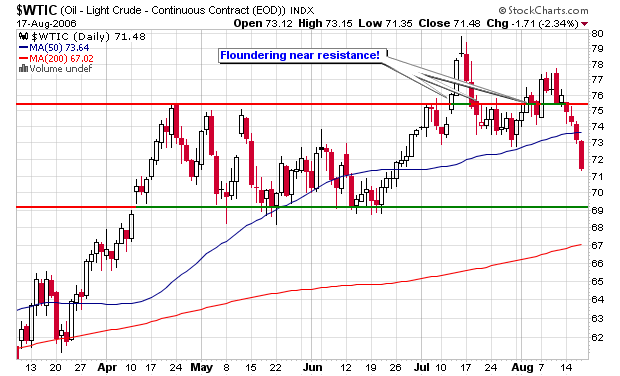
I have also included a chart of the NASDAQ which shows the breather that I indicated in yesterday’s blog entry. The index is pulling back today (expiration day) while some investors ell at this first Fibonacci retracement level. I also included a chart of the crude oil contracts as they are crashing down through the 50-d moving average. Major support is still owner near $69-$70. It will be interesting to see crude challenge this area; territory it hasn’t seen in two months.
Piranha
posted by Chris Perruna @ 11:58 AM
2 comments
![]()


2 Comments:
Chris,
How do you find the fibonacci levels of a stock? Is it part of your screening tools or?
I ask as i've never tried to implement fibonacci analysis in my swing/day trades, however of late since i've been following your blog, you seem to talk quite a bit about it.
Thanks,
Yaser
PS Have a good weekend
Here is a link I use with a quick calculator: http://www.forexnews.com/external/fibonacci/defaultnew.asp?loc=fibo
It's a simple tool. I use the levels for longer term charts but they aren't my main indicator (a secondary indicator).
Post a Comment
<< Home