
New Highs and New lows telling a Story
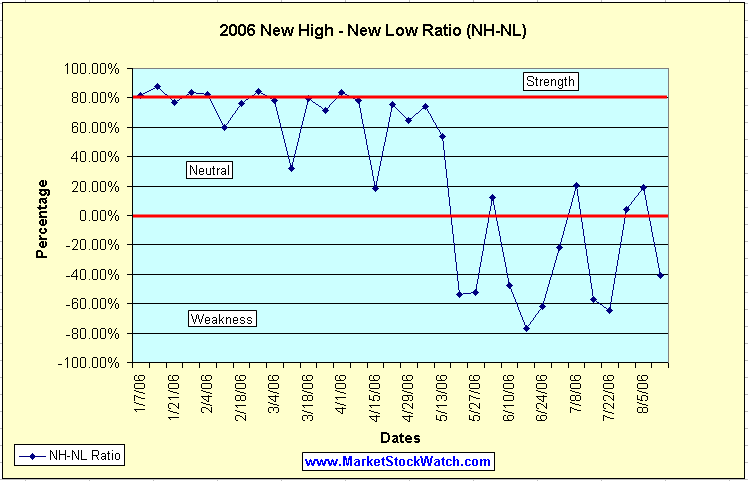
A few months back I asked if the New High – New Low Ratio (NH-NL ratio) was reliable. Take a look at the chart and the numbers and tell me what you think.
The chart in this blog entry was calculated using the simple math explained in an entry I wrote earlier in the year, which can be found here: Is the NH-NL ratio Reliable?
To calculate the percentage correctly, use this formula:
(New Highs – New Lows) / (New Highs + New Lows) * 100 = X%
The one thing I would like to stress is the huge drop from borderline "strength ratios" in April to negative weakness in May (just the time the market started to tell us all to get out and head for the sidelines and lock in gains).
Brett Steenbarger talks briefly about his findings while studying the new highs and new lows in the market. Take a moment to visit his “Market Context” for August 14, 2006 to see what he has to say.
I will conclude by saying that the NH-NL ratio is extremely reliable (lagging but reliable)!
Below is an updated look at the weekly averages for the NH-NL Ratio:
Saturday, January 14, 2006: 500-32
Saturday, January 21, 2006: 348-46
Saturday, January 28, 2006: 516-46
Saturday, February 4, 2006: 449-44
Saturday, February 11, 2006: 229-57
Saturday, February 18, 2006: 306-42
Saturday, February 25, 2006: 420-36
Saturday, March 04, 2006: 399-49
Saturday, March 11, 2006: 162-84
Saturday, March 18, 2006: 459-53
Saturday, March 25, 2006: 312-52
Saturday, April 01, 2006: 441-39
Saturday, April 08, 2006: 481-58
Saturday, April 15, 2006: 150-103
Saturday, April 22, 2006: 540-75
Saturday, April 29, 2006: 353-76
Saturday, May 6, 2006: 503-74
Saturday, May 13, 2006: 384-116
Saturday, May 20, 2006: 64-211
Saturday, May 27, 2006: 57-182
Saturday, June 3, 2006: 119-93
Saturday, June 10, 2006: 72-204
Saturday, June 17, 2006: 41-310
Saturday, June 24, 2006: 56-238
Saturday, July 01, 2006: 127-198
Saturday, July 08, 2006: 143-95
Saturday, July 15, 2006: 74-273
Saturday, July 22, 2006: 66 - 307
Saturday, July 29, 2006: 163-151
Saturday, August 5, 2006: 194-132
Saturday, August 12, 2006: 88-210 - This Past Week
New highs vs. new lows from last week (we were negative all week):
Monday showed a ratio of 83-147
Tuesday showed a ratio of 114-187
Wednesday showed a ratio of 126-235
Thursday showed a ratio of 62-281
Friday showed a ratio of 53-198
Piranha
posted by Chris Perruna @ 1:47 PM
2 comments
![]()


2 Comments:
Chris, the NH-NL is showing higher tops and bottoms and coinciding with what the other major indices are also doing.
I think this can be a good indicator and in fact a leading indicator as you can see that beginning April it never was able to hit the previous highs.
Are you pulling this data your self?
I pull the data from IBD (my NH-NL numbers) and I graph it myself using basic Microsoft excel.
The NH-NL data can be pulled from anywhere but stay consistent with the source!
Post a Comment
<< Home