
NASDAQ looking for Retracements
Several things happened with the NASDAQ during the trading day on Tuesday:
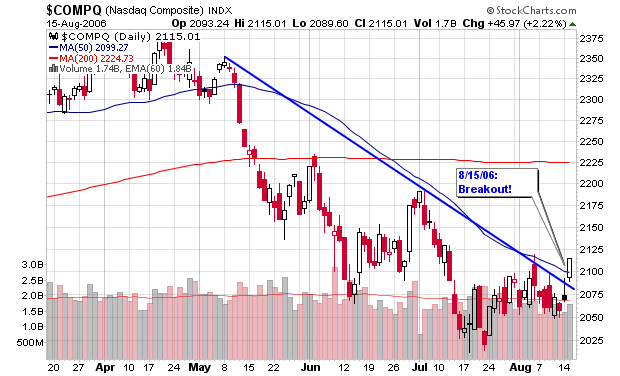
The NASDAQ clearly broke above the down-trend line noted on the chart I have featured several times on this blog while also recovering the 50-d m.a. and the 2,100 resistance level. I spoke at length this past weekend on my weekly analysis over at MSW about these resistance levels and I made an in-depth argument as to why the NASDAQ can reach the retracement levels or re-visit lows set back near 1,900.
Volume was higher on Tuesday than Monday’s action but still light compared to the average since we are in the middle of August (summer volume is always weak).
The new highs topped new lows on Tuesday as most of the positive news could be attributed to the inflation report (the first positive day in more than a week).
Here is some of my commentary from the MSW weekly analysis from this past Sunday:
From 8/13/06:
“Now, if the NASDAQ were to breakout above all three of these levels (speaking about the down-trend line, the 50-d m.a. and the 2,100 resistance level) and individual stocks confirmed, it would be a major short term buy signal, one that I am watching very closely. On the downside; if the NASDAQ were to make a weekly close below the previous low near 2,020, we could be visiting areas between 1,900 and 2,000.
 Where do I see this?
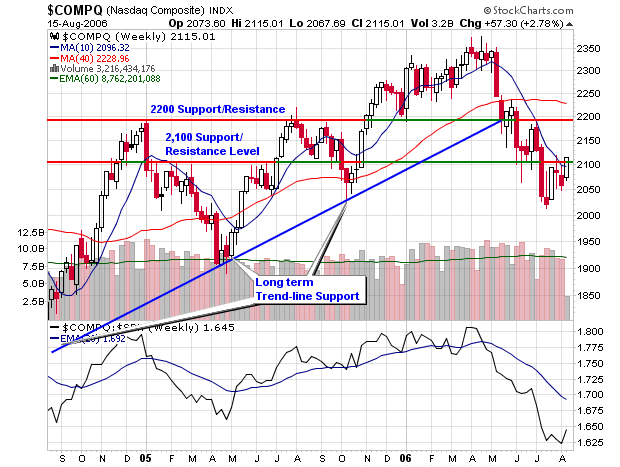
Take a look at the weekly of the NASDAQ and the next level of support near 1,900, set back in April 2005. September is the weakest month of trading for the market over the past decade so I would not be surprised to see this level revisited with a close below 2,000. But…
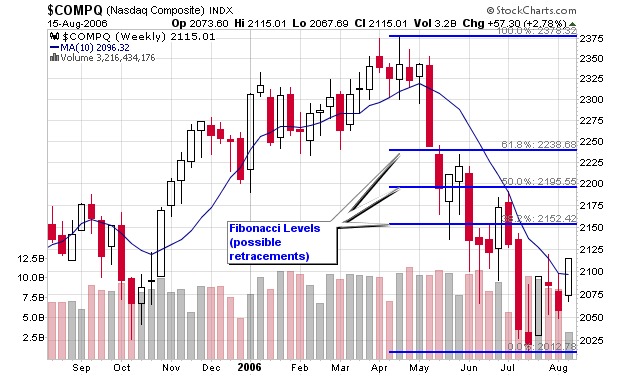
Using 1,900 as the low level of the most recent advance of 2,350 as the peak, we have retracement levels of 2,178, 2,125 and 2,071. With the NASDAQ closing at 2,057 this week and an intra-week low of 2,012 a few weeks back we might expect a rally as a temporary bottom may be developing since all three retracement levels have been met and then some. The Fibonacci retracements suggest that the market is over-sold and could have a short term bounce.
Using 2,378 at the high value and 2,012 as the low value on the daily chart, we can now see that a possible positive retracement can take place to any these three levels:
38.2%: 2,151
50%: 2,195
61.8%: 2,238
Based on recent NASDAQ action, I could see the index reaching the 50% retracement since the most recent peak was set at 2,190 at the end of June and early July (this peak materialized at the 50-d m.a. and the down-trend line found using the daily chart).
I hope I haven’t confused you yet! To recap, I have talked about a possible drop to 1,900 and a possible retracement rally between 2,151 and 2,238. I can’t tell you which one is more likely to happen but that is not my job. My job is to point out possible scenarios and give you an adequate chance to capitalize on the move and be prepared for the possible move. Now that you know what type of moves can happen, you can get yourself ready for possible trades that will allow you to make a profit in either direction (only if you are comfortable trading in both directions). This is how traders make money; they assess the situation and then look for possible trades that can benefit in either direction and they do all of this during their off hours (not during the trading day). Since the work will be done prior to the move, your setups and triggers will be set prior to the action so you will be able to make an unemotional decision in the “heat-of-the-action”.”
 MSW members were privy to this market analysis prior to Tuesday’s move!
With yesterday’s move, we will now see if the first retracement level will be hit and then the possibility of a run to the 50% retracement level (see the attached chart).
Piranha
Labels: General Market
posted by Chris Perruna @ 9:31 AM
2 comments
![]()


2 Comments:
Excellent bit by bit trend dissection Chris. Keep it up.
Thanks Yaser and I look forward to checking out your blog.
Post a Comment
<< Home