Using Fibonacci Retracements
 I was asked this question in my recent comments after posting a NASDAQ chart with Fibonacci retracement levels:
“How do you find the fibonacci levels of a stock? Is it part of your screening tools or?
I ask as i've never tried to implement fibonacci analysis in my swing/day trades, however of late since i've been following your blog, you seem to talk quite a bit about it”
I answered the question with a quick link to a Fibonacci calculator I use and then realized that I don’t have a blog entry for understanding Fibonacci numbers. So instead of rewriting what has already been done, I have decided to point you all to a great blog entry titled How to Use Fibonacci Retracements To Trade Stocks by Craig over at the Swing Trading Guide or better know as the Taz Trader Blog
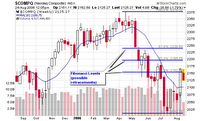
I use Fibonacci retracements for longer term outlooks for major indexes but sometimes use them for individual stocks that may be catching solid support along the 200-d moving average. The most important thing to know is that it is only a secondary indicator in my arsenal, not a front line tool.
If you look at the attached NASDAQ chart, you can see how the index has stalled near the first retracement level as I indicated last week prior to the advance. I suggested a brief consolidation before the NASDAQ looks to move towards the 50% retracement level near 2,195.
By the way, Stockcharts.com has a built-in Fibonacci tool that allows me to draw the levels within seconds. A great tool for their annotated charts!
Piranha


3 Comments:
Thanks Chris!
Thanks for the mention Chris!
Now I just have to write the pages on Fibonacci extensions, Fibonacci expansions, Fibonacci projections...
(the website work never ends!)
;)
Welcome to the both of you!
Post a Comment
<< Home