
Looking at the Market through the NH-NL Ratio
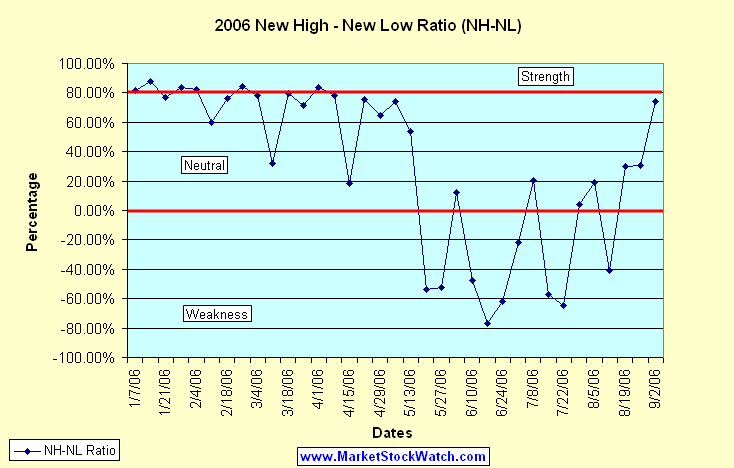
My first topic of discussion is the NH-NL ratio, something I ignored for the majority of the week. As you can see on the list below, we had our third consecutive positive week, the first time since late April and early May and we had the best ratio with the largest number of new highs since the week ending May 13, 2006. Every day was consistent this week without any one day skewing the numbers. The strength wasn’t overwhelming but it wasn’t weak either as the number of new lows fell to the lowest weekly average since the week ending April 1, 2006. The ratio percentage number ended at 74.31%, the highest reading since the week ending May 6, 2006 (74.36%). Notice the higher highs and higher lows on the chart.
Looking back at last year’s numbers, we can see that the entire month of September (2005) was positive with the monthly ratio coming in at 280-85. The largest weekly new highs average was 375 while the largest weekly new lows average was 157 (the final week of the month). The first week of October was positive but we then slipped into three consecutive negative weeks before heading back to positive territory for the next 28 weeks (starting November 5, 2006 and ending May 20, 2006). The phrase “Sell in May and go away” couldn’t have been more appropriate based on this real time data collected on MSW weekly screens. November through April are supposed to be the best months to invest according to historical data provided by the Stock Traders Almanac and this NH-NL ratio data over the past twelve months has proven it to be 100% correct!
As I have mentioned many times in the past, big time Wall Street fund managers and institutional traders go on vacation to the Hamptons, upstate lake side homes and international destinations. While these investors leave, they sell their weak holdings and have their staff sell anything that becomes weak while they are gone. They basically clean house and sell any investments that can’t survive while that are not at the helm. This results in the thin volume that we see year in and year out from June to August. When they get back in September, they continue to clean house and look to revamp their funds and close on a positive note, heading into the New Year. This is not rocket science; look at historical charts for the DOW and NASDAQ and you will see that September and October have provided many lows in the markets over the past few decades. More recently, it has happened in 2001, 2002, 2004 and 2005 (2006?).
Mentioned in the past and according to Elizabeth Thompson’s article ‘Gone away for the Summer? It’s Time to Come Back’, she states, “that the financial world encourages investments in the November through April period more so than in the May through October period.” She further states that January is the month that employees sign up for 401(k) plans while IRA’s have an April deadline which requires investors to place more money in their stock related retirement funds. This type of setup brings an influx of money to the table during the beginning of each year and naturally pushed prices higher before the flat summer months when they typically correct.
September is historically one of the worst performing months in American stock market history but it can also present an ideal opportunity to place positions on stocks that are showing excellent relative strength. Typically, these stocks go on to be market leaders and breakout after Halloween and into the New Year. November through February are some of the best performing months in Wall Street history but if you wait to place positions at the end of this range, you may be buying extended stocks that are poised to drop as the spring ends, creating losses in your portfolio. There are always exceptions to historical data and the rules so we want you to follow the daily and weekly action of the market before buying and selling. History is great but it doesn’t mean the market will always follow the script (if you know what I mean).
Another study suggests that the market will continue do trade the way it has traded for the first five months of the year. If this scenario holds true to 2006, we will be stuck in a sideways market for another four months. Regardless, I will be here researching the leaders and trends and will give you my best analysis outside of predictions and historical data. I feel that this historical data can help some investors realize that the market does work in predictable ways from a long term macro view.
Follow my three most important Indicators:
1. The price and volume of the major indexes (currently moving higher)
2. The action on the NH-NL ratio (3 positive weeks but lacking overwhelming strength)
3. The action among leading individual stocks (very solid week: 3.55% MSW Index gain)
Where do the Major Indexes stand in 2006?
NASDAQ: -0.55%
DOW: +6.97%
NYSE: +8.79%
S&P 500: +5.02%
Below is an updated look at the weekly averages for the NH-NL Ratio:
Saturday, January 14, 2006: 500-32
Saturday, January 21, 2006: 348-46
Saturday, January 28, 2006: 516-46
Saturday, February 4, 2006: 449-44
Saturday, February 11, 2006: 229-57
Saturday, February 18, 2006: 306-42
Saturday, February 25, 2006: 420-36
Saturday, March 04, 2006: 399-49
Saturday, March 11, 2006: 162-84
Saturday, March 18, 2006: 459-53
Saturday, March 25, 2006: 312-52
Saturday, April 01, 2006: 441-39
Saturday, April 08, 2006: 481-58
Saturday, April 15, 2006: 150-103
Saturday, April 22, 2006: 540-75
Saturday, April 29, 2006: 353-76
Saturday, May 6, 2006: 503-74
Saturday, May 13, 2006: 384-116
Saturday, May 20, 2006: 64-211
Saturday, May 27, 2006: 57-182
Saturday, June 3, 2006: 119-93
Saturday, June 10, 2006: 72-204
Saturday, June 17, 2006: 41-310
Saturday, June 24, 2006: 56-238
Saturday, July 01, 2006: 127-198
Saturday, July 08, 2006: 143-95
Saturday, July 15, 2006: 74-273
Saturday, July 22, 2006: 66 - 307
Saturday, July 29, 2006: 163-151
Saturday, August 5, 2006: 194-132
Saturday, August 12, 2006: 88-210
Saturday, August 19, 2006: 178-96
Saturday, August 26, 2006: 140-74
Saturday, September 2, 2006: 285-42 - This Week
New highs vs. new lows from last week:
Monday showed a ratio of 221-52
Tuesday showed a ratio of 260-59
Wednesday showed a ratio of 351-39
Thursday showed a ratio of 293-25
Friday showed a ratio of 299-35
Piranha
posted by Chris Perruna @ 10:45 PM
0 comments
![]()


0 Comments:
Post a Comment
<< Home