
Market Snapshot
I will start with the NASDAQ and will focus on the Fibonacci Retracement chart as the Index is having trouble moving through the 100% retracement level. The index has reversed from highs over the past three weeks but did not flash distribution (as a week) this past week. The NASDAQ has flashed four distribution days over the past month which is enough to signal a major market reversal according to CANSLIM rules.
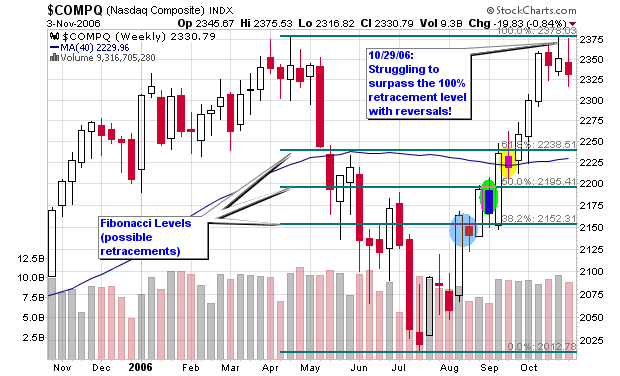
One could also view the weekly chart of the NASDAQ as a deep six month V-shaped pattern with a handle formation. As humans, we can’t argue which chart is correct (the Fibonacci or V—shaped) so we must focus on signals and trade according to those signals. If the market breaks out above the handle, it is telling us to place long positions just as it is giving us the green light to place shorts or buy put options with a continued Fibonacci reversal.
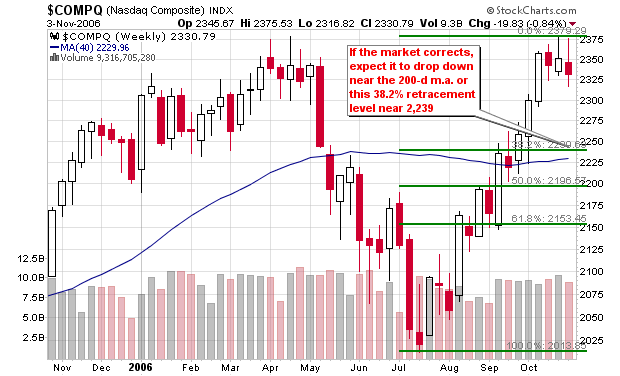
Take a look at the second Fibonacci chart provided which shows where the NASDAQ may reverse if it can’t regain its footing. The logical area would be near the 200-d moving average which is also near the first 38.2% retracement level of 2,239. This same area also serves as the original drop back in May 2006 near the 200-d m.a. Nothing is guaranteed but the signals and setups are there so trade them and cut a loss if you are wrong. It’s not very difficult.
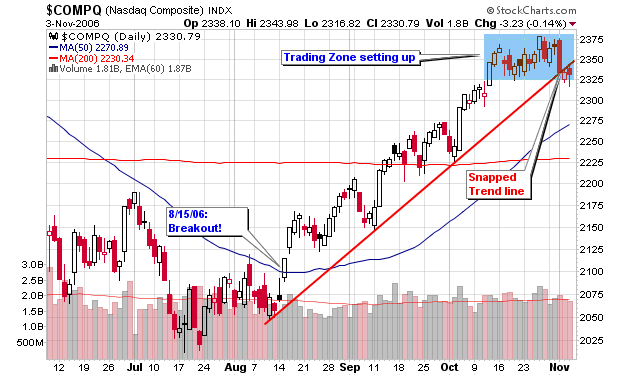
Please remember that Fibonacci retracements are still secondary indicators when compared to price and volume; so don’t make your ultimate decision on a secondary tool. The daily chart of the NASDAQ still shows a trading zone between 2,325 and 2,375 as highlighted in blue on the charts provided. The trend line was snapped as the index is moving sideways with the recent distribution days. Price and volume along with several secondary indicators now point down for the NASDAQ.
The DOW has gained more than 12% over the past four months with an almost straight-up pattern without many breathers. The index reversed from its highs two weeks ago and dropped 0.86% last week on below average volume. The S&P 500 is following the same pattern as it too trades near all-time highs but the weekly down volume continues to come on less than average volume. I have added a Fibonacci graphic on the DOW chart to give you an idea where this tool believes the market will correct. Ironically, the first 38.2% retracement level sits exactly where a handle should have formed before the index moved higher (according to CANSLIM setups).

Other secondary indicators that tell us that the market wants to move lower is the NH-NL ratio which has weakened considerably for the first time in five week as new highs dropped below an average of 300 per day for the first time since late September as new lows have increased to their highest total in a month. We had 688 new highs and only 46 new lows two weeks ago Thursday but had a completely different story told this past Thursday with only 148 new highs and 87 new lows. That’s a 78% decrease in new highs and a 90% increase in new lows. Subtle clues like this can and will paint the picture of what’s going on with the strongest stocks in the market (the leaders). I use the NH-NL ratio as my number one secondary indicator and actually consider it my 1a indicator since it has proven to be so reliable after basic price and volume.
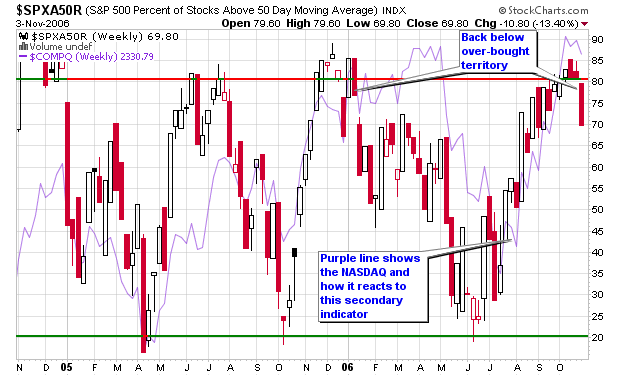
Another indicator is the percentage of stocks trading above their 50-d moving average which spent the past several weeks in overbought territory but has dropped considerably over the past five days (down 13.40% for the week). It took the NASDAQ three months to reverse after this specific indictor gave its signal earlier in the year but the market wasn’t climbing at the extreme angle it is today. It only took the market one month to reverse to the up-side after this indicator gave the over sold indicator in June. Look at the charts page and focus on the light purple line that is plotted behind the chart to see when the NASDAQ was making its move up and down in 2006.
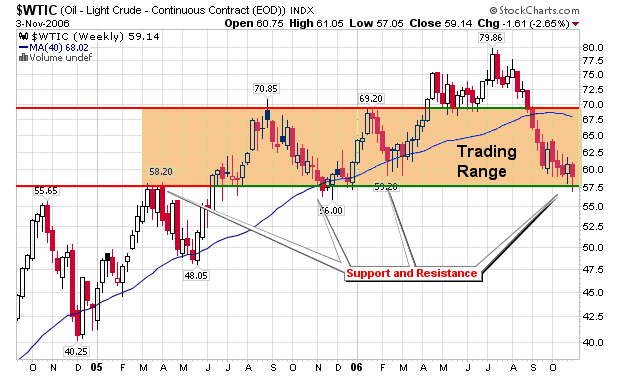
Crude oil is still trading in the range highlighted on the weekly chart and is actually showing more weakness but I have been saying that the elections would probably hold the price down. Gold broke out successfully above the triangular formation that I highlighted last month on the weekly chart and was up over 4.5% for the week as it is trading back at its highest level in two months.

Piranha
Labels: General Market
posted by Chris Perruna @ 9:43 AM
0 comments
![]()


0 Comments:
Post a Comment
<< Home