
NASDAQ followed the Fibonacci Levels
While doing my research this week, I really highlighted how the NASDAQ weekly chart has briefly stalled for one week at each of the three Fibonacci retracement levels. I have been covering the chart since mid-August here on the blog as the index has continued to push higher and stall briefly at the 38.2%, 50.0% and 61.8% levels. With the next recognizable level at 100%, the index has moved higher for three consecutive weeks without a stall.
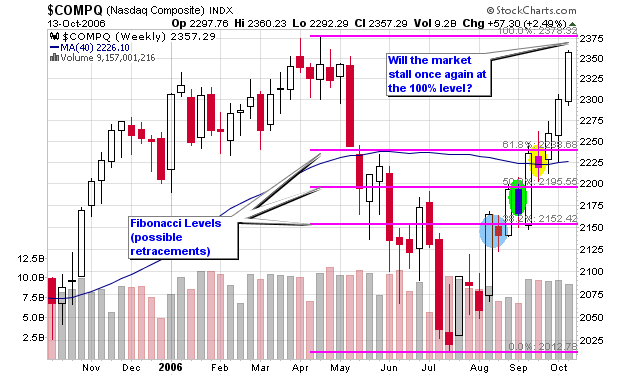
Is this coincidence or is this human nature in action?
I have highlighted the three brief resistance weeks in color while the NASDAQ regrouped before moving higher. It’s an interesting chart that shows how the market corrected at each level on lower volume than the previous week which gave us a clue that the NASDAQ wanted to move higher.
Let’s wait and see what will happen when it reaches the 100% level. Will this be the final push higher and the first major signal of a market reversal?
I covered the chart on the blog in these posts as it materialized in real-time:
8/16/06:
NASDAQ looking for Retracements
8/17/06:
NASDAQ creating Trading Opportunities
8/24/06:
Using Fibonacci Retracements
8/31/06:
Current Market Temperature
9/15/06:
Weekly Market Review
10/04/06:
Talking Heads at it Again!
Piranha
Labels: General Market
posted by Chris Perruna @ 8:31 AM
0 comments
![]()


0 Comments:
Post a Comment
<< Home