
CB Richard Ellis Group, CBG, is an All-Star Stock
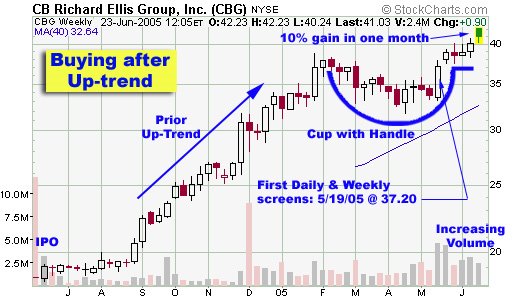
 CB Richard Ellis Group, Inc. (CBG) was first screened on MSW on Thursday, May 19, 2005 at $37.22. We established a breakout and/or pivot point of $38.95 and declared a strong support level near $33.00. I instantly saw a company with great potential even though we weren’t talking about a new technology or juicy subject. The chart at the bottom of this blog post shows what I was looking at last summer as the stock started to make its run. Here is a link to a blog post I made in August 2005 after the stock was already up over 30% in 10 weeks:
CBG Blog - August 2005
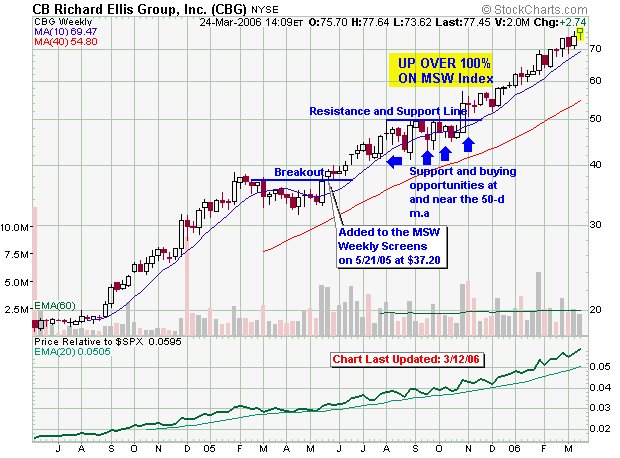
The stock ran into resistance early last fall but we held tight since it wasn’t violating the 50-d m.a. with distribution days. For 13 weeks, the stock traded sideways before breaking out once again, above $50 per share. It hasn’t looked back and is trading at a new high once again today above $77 per share. The stock has made 40 consecutive weekly screens (now referred to as the MSW Index). If the stock continues to travel through the $60-$100 run, it will become a long term capital gain and those gains will be well over 100% in only twelve months without much risk along the way. Looking at the chart, we can see the slow steady growth since the original breakout in May 2005.
Keep one thing in mind: Don’t hold the position for tax implications if it suddenly started to fall. Sell immediately and take the profits because they should exceed the difference between short term and long term capital gains (if the stock tanks). If it trades sideways or better yet, continues to move higher, hold and don’t sell until we see the first set of red flag warnings.
Now I will compare the fundamental numbers I crunched in August 2005 and some new numbers I crunched earlier today:
***Note the difference in institutional supporters over the past 10 months (almost 400 new institutional holders which explains the 100% advance perfectly!***
Current Fundamental Numbers (3/24/06):
3-Year EPS Rate: 97%
3-Year Sales Rate: 40%
PEG Ratio: 1.17
ROE: 32%
Updated EPS Analysis:
2003: -0.34
2004: 0.91
2005: 2.84
2006: 3.60 (E)
2007: 4.17 (E)
Number of Institutions (last reporting period):
Total: 523
Money Mangers: 207
Mutual Funds: 296
Other: 20
August 2005 Fundamental Numbers:
3-Year EPS Rate: 65%
3-Year Sales Rate: 54%
PEG Ratio: 1.20
ROE: 22%
EPS Analysis:
2003: -0.23
2004: 1.65
2005: 2.24 (E)
2006: 2.39 (E)
Number of Institutions (last reporting period):
Total: 111
Money Mangers: 51
Mutual Funds: 56
Other: 4
Piranha
posted by Chris Perruna @ 3:17 PM
0 comments
![]()


0 Comments:
Post a Comment
<< Home