Weekly Market Review
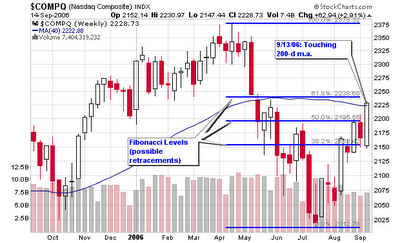
The NASDAQ is up almost 3% for the week as it has traveled from the 38.2% retracement level, thru the 50% retracement level to slightly below the 61.8% level. The highest retracement level is not important as I have been focused more on the 200-day moving average and the support/resistance level at 2,200. The NASDAQ is trading above the 200-d m.a. for the first time since May hence the statement “Sell in May and go Away”. I have been discussing and studying the markets around that statement strategy for three years now. It’s been very accurate since the bubble burst in 2000.
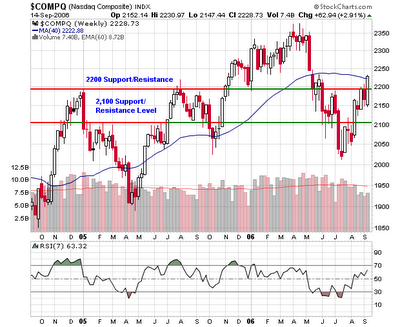
Looking at a daily chart, we can see the index is now trading between an upper and lower channel range with current prices touching the upper side. A move above this level will alert me that a short opportunity may become possible as the index would be too extended. Since today is options expiration day, I wouldn’t advise too much intraday activity.

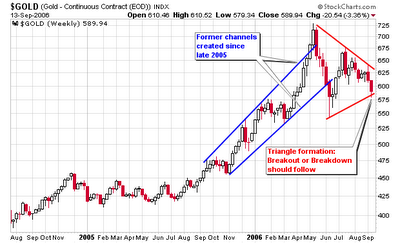
Gold continuous contracts are forming a triangle pattern as noted on the chart with red lines. The former trading range between $600 and $650 no longer applies as we are now below $600 for the first time in months. This will be an interesting play but don’t jump the gun and enter before a signal to either side.
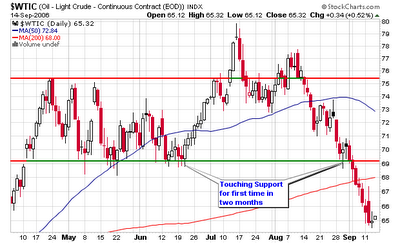
Crude oil contracts are trading at their lowest levels since March and are in a clear downtrend with 17 of the last 27 days giving us a loss. If you look at the weekly chart, you can see that Crude has violated the 200-d m.a. in the past and recovered so I am not sure if it is ready to turn over yet. I don’t suggest a long position until the contracts can recover their 200-d m.a. and the former support line which now acts as resistance. It is very important to wait for the signal before entering a trade because the market doesn’t follow what you “think may happen”. Let the market show you what it wants to do and then trade what it is saying.

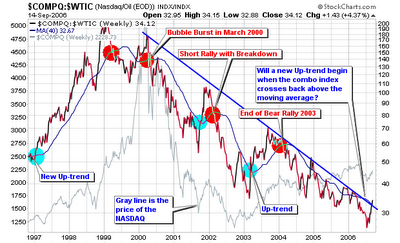
Due to the weakness in crude, the NASDAQ-Crude combo index is now above the long term down trend line for the first time in years. We have rallied several times over the past five years when October shows its face and this year could be similar. I don’t know if this is the start to a further rally or just another head fake in 2006. This combo index is purely a secondary indicator so don’t make any decisions based solely from this chart. This chart is here to confirm your beliefs from other front line indicators such as price and volume and that’s it.
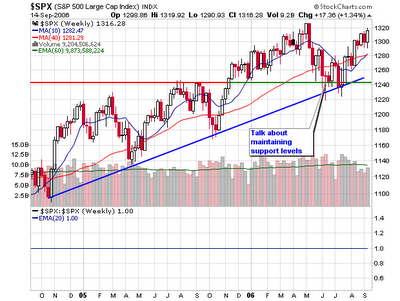
Moving on to the DOW and S&P 500, we can see clear cup shaped bases that are currently building the right side. The S&P 500 base is a bit more rounded than the DOW as I would like to see handle formation before a move to new highs. I know the market doesn’t care what I want but both indexes are up about 10% since their bottoms from earlier in the year so we need to shake out the weak holders before making new highs.
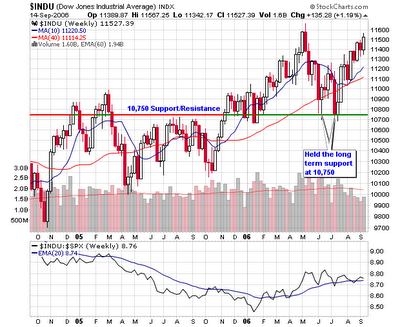
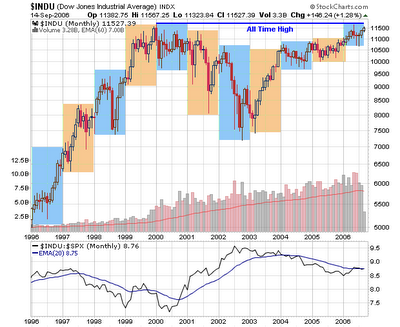
Speaking of highs, the DOW can attempt to make an all-time high if it continues to push north. If we really want to dissect this chart, we can say that a seven year cup shaped base has formed as we are about to close the right side of that pattern and possibly form a handle. I don’t typically look at bases in yearly terms but I couldn’t ignore what I see.
Finally, all of this means nothing to me if the New High – New Low (NH-NL) ratio can’t confirm the action. As a CANSLIM trend trader, I am not prepared to make any long commitments until I can see the NH-NL ratio consistently reach 500 news highs per day and individual leaders making new highs on above average volume. Some individual stocks are acting this way but many more are still reversing after their false breakouts.
Trust me, when the NH-NL ratio starts to record 500-800+ new highs per day, we will be well on our way to the next sustainable bull market. Until then, play the short term moves and always employ solid money management techniques and always sell losses short!
Have a great weekend,
Piranha
Labels: General Market


2 Comments:
Chris,
What's the NH-NL ratio telling you now? Since the market has been quite bullish, don't you think a very high NH-NL ratio could be a contrary indicator?
Short interest is also at 5 year highs as I reported on my blog (possible contrarian indicator).
It would be make or break this Wednesday 2:15 pm. Till then its all about the Fed's rhetoric
yaser,
I'll post the updated chart later in the day today! It's still lacking strength. My indicators are telling me the market is overbought!
Post a Comment
<< Home