
Exchange Stocks: ISE w/ ICE & BOT
Case Study
10/10/2006
ISE – International Securities Exchange Holdings Inc.
Industry: Financial Services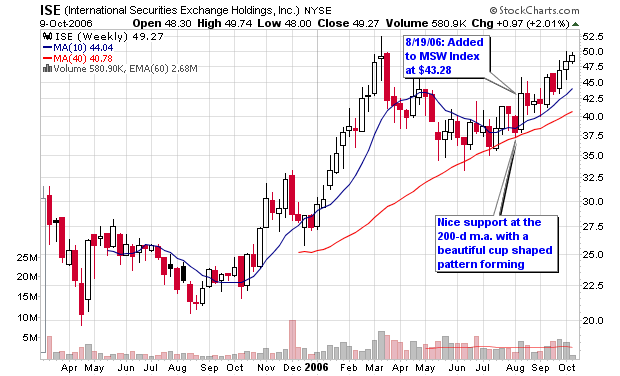 The company provides a fully electronic securities exchange for listed equity and index options. Sister stocks such as ICE, BOT and CME have been gaining strength over the past month as several of them are members on the MSW Index so I thought it would be a good time to write a case study and give them all the kiss of death (a joke of mine). I have had a history of writing case studies for stocks I own and cover that were performing nicely only to see them decline after the analysis. For example, I wrote a very detailed case study on BOT back in March (near the peak) which was uploaded to this blog earlier today. The stock corrected before rebounding over the summer and has recently blasted to new highs on above average volume. If all things hold true, this should be the top for ISE as I have just jinxed the beautiful cup shaped pattern.
Sister Stocks:
IntercontinentalExchange - ICE
Chicago Mercantile Exchange – CME (P/E: 48)
CBOT Holdings – BOT (P/E: 62)
Cash America Intl Inc. - CSH
First Marblehead Corp - FMD
Key Ratings:
Overall Rating in IBD: A+
EPS Rating: 95
Relative Price: 97
Industry Group Rank: 52 (of 197)
3-Year EPS Rate: 28%
3-Year Sales Rate: 24%
ROE: 26.53%
PEG: 1.87 (too high for my tastes!)
P/E: 36.3
EPS Analysis (yearly):
2002: 0.04
2003: 0.60
2004: 0.77
2005: 0.93
2006: 1.33 (estimate)
2007: 1.59 (estimate)
Revenue (in millions):
2002: 73.41
2003: 100.5
2004: 125.4
2005: 155.9
Net Income (in millions):
2002: 0.80
2003: 20.2
2004: 26.1
2005: 35.3
Pretax Income (in millions):
2002: 3.60
2003: 36.0
2004: 51.7
2005: 65.1
Cash (in millions):
2003: 92.9
2004: 171
Cash Flow (in millions):
2003: 21.6
2004: 30.1
2005: 41.4
Number of Institutions (last reporting period):
% Shares held by Institutions: 62%
Total Institutions: 295
Money Market: 114
Mutual Funds: 172
Other: 9
Top Institutional Holder: Bamco, Inc. (3.5 million shares) 0.02% of portfolio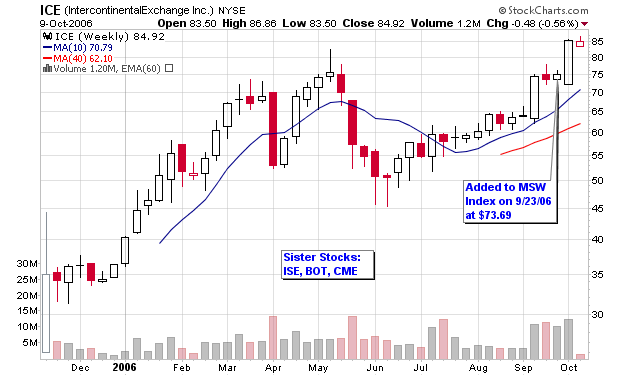 Some of the fundamental causes for concern are the above average price earnings ratio versus the entire industry and the S&P 500 and the high price to book value which almost doubles the industry standard and triples the average on the S&P 500. The current price of the company must be considered a premium when compared to the industry and the market.
Does this matter?
According to William O’Neil, strong stocks must be bought at premiums just as luxury items in life are bought at premiums. Competition is moving in on the company as the profit margins are shrinking within the industry.
Moving to technical analysis, we can see that most of the stocks in the industry are moving higher and ISE is forming a beautiful cup shaped pattern that has formed over the past seven months. The top of the right side of the pattern should come to a close near $50-$52 and then form a handle in order to shake out weak holders. The 200-d m.a. has been acting as support while the right side of the base forms so look to this area as a fall-back zone if the stocks decides to correct.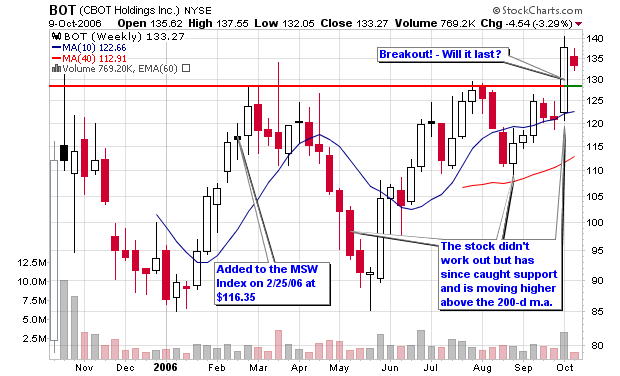 Both ICE and BOT have moved on to new 52-weeks highs so ISE may be seen as the laggard but the base is great. As long as a handle forms and a pivot point is established, I will enter at the ideal time only if the “M” in CANSLIM is cooperating. The major indexes are extended so I am not sure if this will all come together at the proper time but it is a very interesting development to watch. The stock is already up over 15% in six weeks on the MSW Index so we can always take profits if things turn badly!
Piranha
posted by Chris Perruna @ 1:30 PM
0 comments
![]()


0 Comments:
Post a Comment
<< Home