
Review: CBOT Holdings Case Study (March 2006)
I wrote a detailed case study on CBOT Holdings back in March 2006 and wrote a brief blog post titled Is BOT the next CME? but I picked the stock near its peak and was forced to sell. It rebounded over the summer months after it’s collapse and has recently blasted to new highs. The entire sector is acting with strength so I have decided to write another case study about ISE which will be uploaded later in the day. Note one major thing about institutional holdings: 3% of the shares were held back in March for a total of 138 institutional investors; that number has increased to 16% held with 204 institutional investors now owning shares (Scout Capital Management is now the top holder with more than 1 million shares).
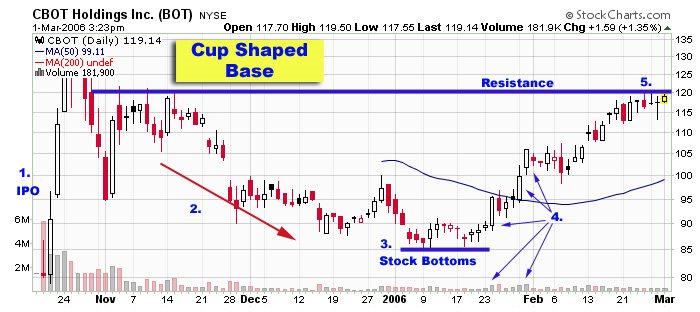
Here is what I was looking at back in March 2006 with BOT:
CASE STUDY – Another successful Exchange Stock?
3/1/2006
BOT – CBOT Holdings Inc. CL A
Industry: Financial Services
Company Profile:
Cbot Holdings, Inc.. The Group''s principal activities is to derive exchange based on contract volume with global listed futures and options on futures contracts. The Group operates in two reportable segments: Exchange Trading and Real Estate Operations. The exchange trading segment primarily consists of revenue and expenses from both the electronic trading and open-auction platforms, as well as from the sale of related market data to vendors and from clearing services. The real estate operations segment consists of revenue and expenses from renting and managing our real estate. We allocate indirect expenses to each operating segment. – profile published by Ameritrade
Analysis from the first week it was added to the MSW Index (2/25/06):
Price on 2/25/06: $116.35
Buy Point: $122.00
Support: $105.00 The stock looks expensive but the market is in favor of financial stocks and especially exchanges (take a look at CME – I missed that one on the move from $60 to $425 over the past two years). The recent IPO is about to challenge the 52-week highs as it sits 13.5% from that high. I found it through a search for stocks within 15% of a new high with solid fundamentals. My Target is $175 for the next 6-12 months.
Sister Stocks:
Chicago Mercantile Exchange - CME
International Securities Exchange – ISE
Asta Funding – ASFI
Global Payments – GPN
Euronet Worldwide - EEFT
Key Ratings:
Overall Rating in IBD: A+
EPS Rating: 98
Relative Price: 87
Industry Group Rank: 27 (of 197)
3-Year EPS Rate: 25%
3-Year Sales Rate: 12%
ROE: 15.98%
PEG: 2.88 (very high)
P/E: 108.95 (cause for concern)
EPS Analysis (yearly):
2004: 0.80
2005: 1.53
2006: 2.53 (mean estimate)
2007: 3.09 (mean estimate)
Revenue: (in thousands)
2002: 308,273
2003: 381,302
2004: 380,193
2005: 466,573
Net Income: (in thousands)
2002: 34,311
2003: 30,707
2004: 41,985
2005: 76,543
Pretax Income (in thousands):
2002: 59,033
2003: 116,814
2004: 74,223
Total Assets (in millions):
2003: 483,981
2004: 460,416
Long Term Debt:
2004: 31,074
2005: 10,716
Number of Institutions (last reporting period):
% Shares held by Institutions: 3%
Total Institutions: 69
Money Market: 49
Mutual Funds: 19
Other: 1
Top Institutional Holder: Mazama Capital Management, Inc. (606,932 shares) 0.01% of portfolio
Chart Legend:
Piranha
posted by Chris Perruna @ 9:59 AM
0 comments
![]()


0 Comments:
Post a Comment
<< Home