
Las Vegas Sands - LVS
 I am sure many of you have seen the latest Forbes 400 list by now but if you haven’t, take the time to read over the list and pay careful attention to an article titled :
Another Hour, Another Million
The article is about Sheldon Adelson, the owner and CEO of Las Vegas Sands, LVS, a long time favorite of the MSW screens in 2006. The man was worth approximately $3 billion just two years ago but his wealth has skyrocketed to more than $20 billion since taking LVS public. According to the article’s calculations, Mr. Adelson, could surpass Bill Gates as the richest man on the planet by 2012 if all variables remain relatively equal. He has earned about $23.6 million per day and almost $1 million per hour over the past two years.
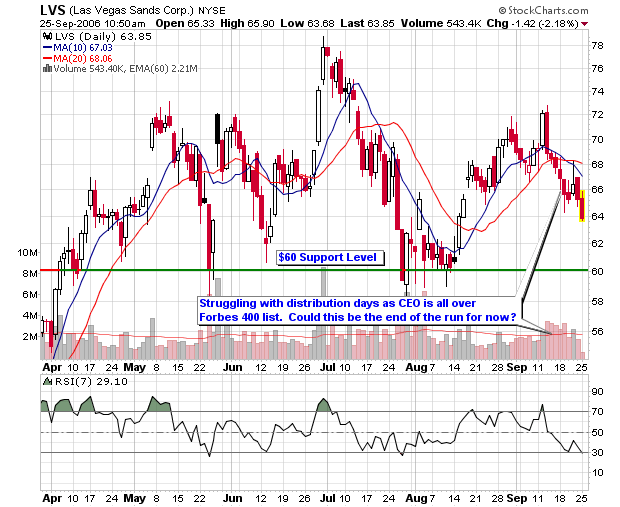
Why does this interest me? Because I have owned shares earlier in 2006 and currently own new shares in his public company: LVS. I bought shares back in the first week of April and sold them in July as the stock took out the 50-d moving average. After catching support near $60 in July (above the 200-d m.a.), I entered once again in August but have not profited this second go-around (at this point in time). I am now even with my latest position and have become concerned with the CEO making headlines with his own article in Forbes. I have learned from past market experts such as William O’Neil, Bernard Baruch and Gerald Loeb that headlines could be the sign of trouble ahead, at least for the stock.
Looking at the charts, my stop is near (slightly below) the support level of $60 so I will monitor the situation closely to make sure a loss doesn’t grow. I have already told a few people that a hedge to protect the down side may be warranted but the most important thing is to follow your rules and original objectives in the trade.
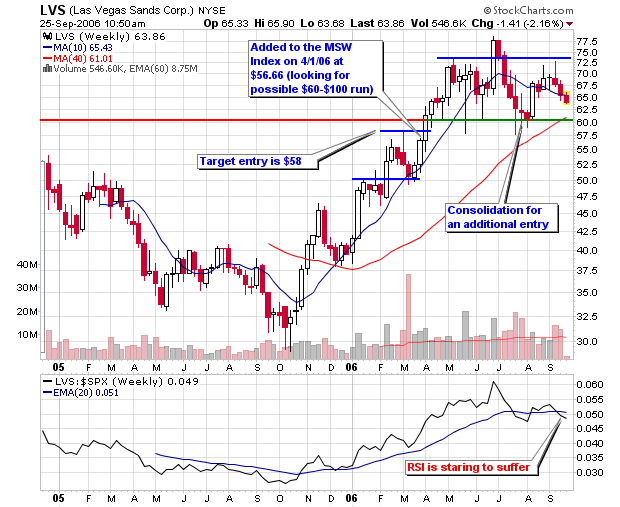
I have provided some of the analysis I have posted to the MSW Index over the past six months. I selected a couple entries from each month as selecting all would take up too much space on the blog. When listed on April 1, 2006, support was placed at the 50-d m.a. with an entry at $58. This was triggered the following week and away we went! The stock was up over 37% within three months on the MSW Index before topping and consolidating over the summer with support near $60. The stock was originally added as a $60-$100 candidate and was off to the races but hit a dead summer dry spell and corrected. Time will tells us when this stock is headed!
4/1/06: LVS makes its first MSW Index
LVS - 56.66, The stock has been screened many times (daily) over the past several weeks so I have decided to add it after further research. The stock comes to the Index as a possible $60-$100 candidate over the next twelve months. The strong 8% move this past week gives us the feeling that the young stock is ready to move. I am also looking at the September call options (in the money calls).
4/8/06:
LVS - 61.41, I said I felt the stock was ready to move and I was right as I added it to the MSW Index last week. The stock gained 8.38% on above average volume as it entered the $60 trading range. I see the stock settling down and pulling back a bit before resuming the advance. Rating: Hold
4/15/06:
LVS - 64.10, The stock continues to move higher and maintain its quick success on the MSW Index. This was a $60-$100 play so give it time to work out and stay patient. Rating: Hold
4/22/06:
LVS - 63.97, A break from the action this week as the stop slipped slightly as volume was near average. The stock is extended from the 200-d m.a. so look for a new entry to form. Rating: Hold
4/29/06:
LVS - 64.81, Earnings come out this Thursday so be ready for that up or down swing. If numbers keep in-line with past reports, I expect the stock to beat expectations and move higher (a hard stop is advisable to protect from bad news). Rating: Hold
5/6/06:
LVS - 71.32, Up over 7% on Friday, bringing the weekly gain to 10% after earnings came out positive. The move was anticipated if earnings stayed in line with the past (as I noted last week). The stock is up 26% in one month on the Index. Rating: Hold
5/13/06:
LVS - 68.12, Down 4.49% this week as the stock holds a RS rating of 95 and remains above the most recent breakout area of $65 (our first level of support) Rating: Hold
6/10/06:
LVS – 65.50, The stock is trading on the 50-d m.a. and managed to gather some support when it violated the line on Thursday. The market is weak but I still have the stock targeted for the run from $60 to $100. Rating: Hold
6/24/06:
LVS – 66.87, Still trading along the 50-d m.a. with an upward bias. This is the type of stock that I like to buy longer term options for the possible $60-$100 run. I would look at December or January options (in the money options are best IMO). The market is weak but I still have the stock targeted for the run from $60 to $100. Rating: Entry is now for $60-$100 run
7/01/06:
LVS – 77.86, What can I say - the stock broke out and is powering through the $60-$100 run regardless of the overall market environment. It traded sideways for seven weeks before making a huge move this week - signs of a great stock. Rating: Final entry passed last week
7/08/06:
LVS – 73.81, A pullback after the breakout last week. The stock is showing support above the short term $73 level. A break below $73 will probably bring the stock back towards $70. Rating: Wait to see if it will continue pullback towards $70
7/29/06:
LVS – 62.77, Last week I said: "The weekly chart shows strong support near $65 as a drop below this level will bring the stock back down near $60." As I said, the stock visited $60 and managed to close slightly above the area. Rating: the $60-$100 run has been hurt with major distribution in July but I am keeping the stock around for another week. It is does close below $60 and stay there, LVS is gone from the MSW Index.
8/12/06:
LVS – 60.33, Six consecutive down weeks but the weekly chart is still suggesting that buyers are starting to step back into the stock above $60. If it does close below $60 and stays there, LVS is gone from the MSW Index. Three weeks of distribution during the recent slide but a support area may be forming. Rating: Hold at current level with a sell below the 200-d m.a.
8/26/06:
LVS – 66.27, The stock is meeting resistance once again but has setup a double top breakout above $69 on the P&F chart. The decline last week did not qualify as distribution since the volume was below average. Still a hold in my book with the $60-$100 advance remaining a possibility as long as it trades above $60. Rating: Hold at current level with a sell below the 200-d m.a.
9/9/06:
LVS – 69.26, Clinging above the 50-d m.a. but volume was lighter on Friday as it moved forward by 2%. If LVS starts to struggle making higher highs, holders should become concerned. Institutional support is there but they can bail and the volume will be the story teller. Rating: Hold at current level with a sell below the 200-d m.a.
9/23/06:
LVS – 65.27, Sheldon Adelson has been making the news everywhere this weekend after his making a splash on the latest Forbes 400 richest list. He is the owner of LVS and has allegedly made just under $1 million per hour over the past two years. I am going to write a lengthy blog post about LVS and the appearance of the CEO all over the news. Could this be the start to a long slide? You heard it here first as I am now concerned. We all know that many stocks collapse when their CEO's make the major news networks and magazines. Rating: Hold at current level with a sell below the 200-d m.a. I may short sell if it closes below the 200-d m.a.
Piranha
posted by Chris Perruna @ 1:43 PM
3 comments
![]()


3 Comments:
LVS is starting to look like a head and shoulders pattern. It's a stock I don't think I would trade until it either broke above 73 or below 58.
Good point about the magazine cover article. Those are often kisses of death for stocks. I can't recall if the negative omen applies to all magazine covers, or non-business magazines (like Time or Newsweek).
Actually, on second thought, if I were betting one way or the other, I'd probably bet that a short is the way to go. The stock looks like it is setting up a possible right shoulder, and according to O'Neill's book, I think that the right shoulder is supposed to be lower than the left. LVS qualifies.
I agree with Terry that it is a potential short. WYNN in the same group looks like a failed base. Not seeing any good leadership in the group.
Post a Comment
<< Home