Market Talk with Piranha is currently moving to its new home at chrisperruna.com. The new site is up and running but many of the posts need editing as the images and stock charts did not transfer successfully (thanks blogger). I will post all new entries to both blogs – Thank you for your patience while I make this change!

Friday, December 01, 2006

New High - New Low Ratio

Here’s the latest NH-NL ratio chart with weekly numbers updated to the week prior to the Thanksgiving holiday. I excluded the short week so it wouldn’t skew the chart. Although the week ending on Saturday, November 18, 2006 had the highest average number of new highs (541) for the year, the strength calculation ranked it tenth in 2006 behind many of the readings from January and October. New highs were greater during the week of 11/13-11/17 but the strength was less than three of the weeks in October which saw the number of new lows 30%-50% lower. Both sets of numbers play an equal role in the calculation of this NH-NL strength ratio.
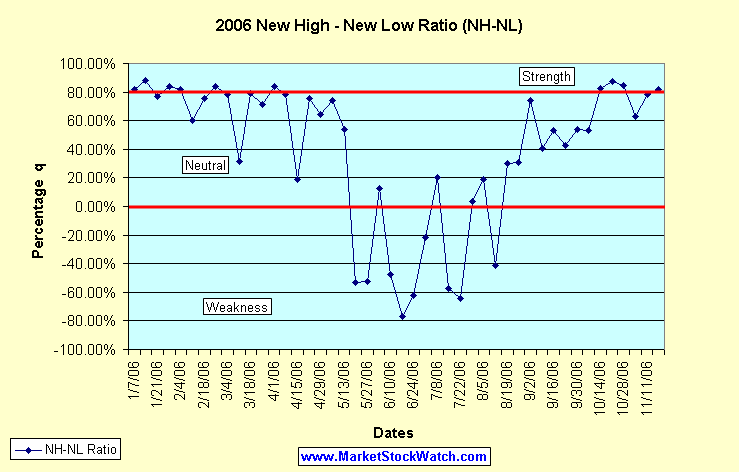


Yesterday saw a reading of 525-35 which equals an 87% rating but the readings were weaker earlier in the week so the total won’t make the top 10 (as long as today is quiet). In addition to the NH-NL chart, I wanted to post the chart of the number of stocks on the S&P 500 that are trading above their 50-d m.a. because it has slipped to its lowest level since August.

To calculate the percentage correctly, use this formula:
(New Highs – New Lows) / (New Highs + New Lows) * 100 = X%

Below is an updated look at the weekly averages for the NH-NL Ratio:
Saturday, January 14, 2006: 500-32
Saturday, January 21, 2006: 348-46
Saturday, January 28, 2006: 516-46
Saturday, February 4, 2006: 449-44
Saturday, February 11, 2006: 229-57
Saturday, February 18, 2006: 306-42
Saturday, February 25, 2006: 420-36
Saturday, March 04, 2006: 399-49
Saturday, March 11, 2006: 162-84
Saturday, March 18, 2006: 459-53
Saturday, March 25, 2006: 312-52
Saturday, April 01, 2006: 441-39
Saturday, April 08, 2006: 481-58
Saturday, April 15, 2006: 150-103
Saturday, April 22, 2006: 540-75
Saturday, April 29, 2006: 353-76
Saturday, May 6, 2006: 503-74
Saturday, May 13, 2006: 384-116
Saturday, May 20, 2006: 64-211
Saturday, May 27, 2006: 57-182
Saturday, June 3, 2006: 119-93
Saturday, June 10, 2006: 72-204
Saturday, June 17, 2006: 41-310
Saturday, June 24, 2006: 56-238
Saturday, July 01, 2006: 127-198
Saturday, July 08, 2006: 143-95
Saturday, July 15, 2006: 74-273
Saturday, July 22, 2006: 66 - 307
Saturday, July 29, 2006: 163-151
Saturday, August 5, 2006: 194-132
Saturday, August 12, 2006: 88-210
Saturday, August 19, 2006: 178-96
Saturday, August 26, 2006: 140-74
Saturday, September 2, 2006: 285-42
Saturday, September 9, 2006: 143-60
Saturday, September 16, 2006: 244-75
Saturday, September 23, 2006: 206-83
Saturday, September 30, 2006: 251-75
Saturday, October 7, 2006: 301-92
Saturday, October 14, 2006: 412-40
Saturday, October 21, 2006: 442-29
Saturday, October 28, 2006: 480-40
Saturday, November 4, 2006: 251-57
Saturday, November 11, 2006: 388-48
Saturday, November 18, 2006: 541-55 - most new highs in 2006 (weekly average)


Piranha

Labels:

Monday, November 20, 2006

Secondary Indicators telling Stories

The New High – New Low ratio (NH-NL) had its highest average number of new highs last week with a final tally of 541-55. It was only the fifth week of the year that had new highs average 500 or more stocks per day. It was also the highest new highs weekly average since the spring of 2005 (prior to me publishing the breakdown with the NH-NL chart). Daily new highs topped 613, 756 and 620 during the middle of last week for the best three day run of 2006 with Wednesday, November 15, 2006 giving us the strongest one day total since Wednesday, April 19, 2006 when the ratio finished at 759-61.


That was the second strongest week of the year with an average ratio of 540-75, just one new high per day less than this past week (new lows averaged 20 less last week than they did during that week in April). Even though the market averaged more than 500 new highs per day, the weakest total came on Friday as new highs dropped considerably as you can see in the table below:

New Highs vs. New Lows - Daily Breakdown, 11/13/06-11/17/06:
Monday showed a ratio of 423-59
Tuesday showed a ratio of 613-71
Wednesday showed a ratio of 756-58
Thursday showed a ratio of 620-40
Friday showed a ratio of 291-46

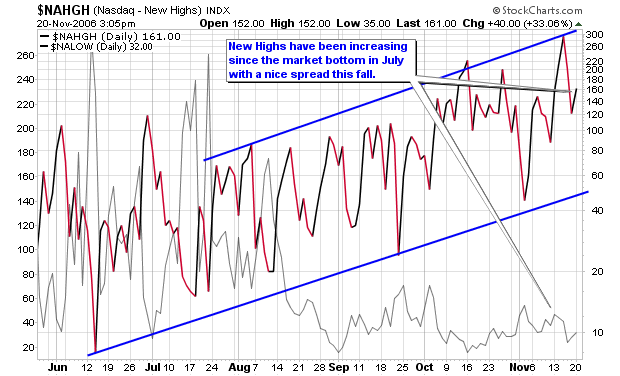
The accompanying chart shows us the up-trending fashion of new highs on the NASDAQ over the past six months. June and July were very sloppy with mixed results as separation became very clear in mid-August as new highs accelerated their advance while new lows decreased considerably and maintained a low profile.

The NASDAQ completed the 100% retracement that I have been following since August here on the blog and has blasted higher on above average volume. As you can see, the index stalled briefly at each retracement level before moving higher and did so in perfect Fibonacci fashion. I am not a complete Fibonacci buff but I do watch for these levels as they seem to apply in longer term weekly charts more often than not.


Viewing the daily chart, we can see that the NASDAQ is still trending above the support line that dates back to early August with one slight violation earlier this month. I thought that was the trend reversal but the market quickly proved me wrong and forced me to cover a couple short positions. I also covered a few long positions that actually went higher but I can’t complain because getting out on top is not the objective when trading. Trading the signals and making a profit is my sole objective (picking bottoms and tops are great for blog stories but don’t translate well to portfolios – at least not mine).


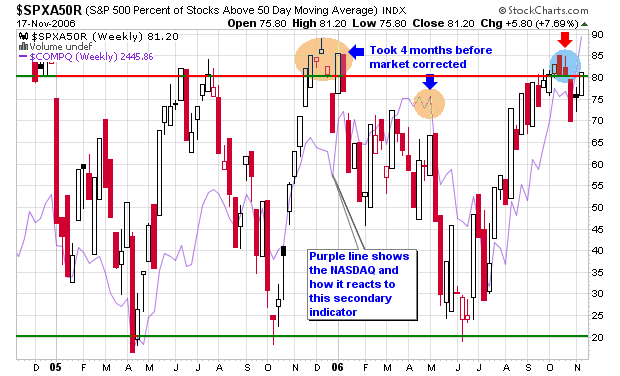
The number of stocks trading above their 50-d moving average in the chart titled $SPXA50R is flirting around the extended area of 80 for the first time since November and December of last year. The lesson we can learn here is the fact that the market didn’t roll over until May of 2006 which means that this secondary indicator is a warning of what may come in the future. I can say this with confidence because the indicator also bottomed a full month in advance of the NASDAQ bottom in July but predicted the move perfectly. Again, this is only a secondary indicator but we are now one month removed from the first peak above the 80% level which could be the start of the warning bells and red flags that the up-trend is winding down. The last topping warning took almost five months to materialize so keep that in mind.


Another of the interesting secondary indicators we have been following on this blog is the relationship between large cap and small cap stocks. Small caps have been beating up larger caps in terms of performance since June 2000 with a few slight down trends from time to time. This was a year where large caps took the lead and were outperforming their smaller cap peers until the past two months. Small caps started to gain strength heading into the election and bounced off of the imaginary trendline on the chart below and have started to catch up in gains with their large cap friends. Many of these smaller cap growth stocks can capture sizable gains in shorter periods of time versus their large cap peers and this is why the overall trend has been higher for the greater part of this century. I wrote about the strength among large caps several times this year but I am firmly invested in smaller cap companies such as the ones listed on the MSW Index.


Some of the recent top performers from the MSW Index are listed below. As you can see from the numbers posted at the end of the day last Friday, the NASDAQ is quickly catching up to the performance of the DOW and S&P 500 in 2006. The NASDAQ was once down about 10% for the year and is now up over 10% and only 5% behind the DOW. How quickly things can change.

Where do the Major Indexes stand in 2006?
NASDAQ: +10.91%
DOW: +15.16%
NYSE: +14.74%
S&P 500: +12.25%

Top Performing MSW Index Stocks last week:
ICE: 18.90%
LRCX: 8.46%
ISE: 5.09%
LVS: 3.91%
JLL: 3.39%
GILD: 3.10%
AB: 2.28%

Here are the total gains of the current crop of MSW Longs:
LRCX: 19.88%, since 9/30/06
BLKB: 34.52%, since 8/5/06
LVS: 59.99%, since 4/1/06
GILD: 11.12%, since 7/29/06
ICE: 37.33%, since 9/23/06
EZPW: 29.39%, since 6/24/06
AB: 16.23%, since 7/29/06
ISE: 17.31%, since 8/19/06
JLL: 9.29%, since 9/9/06
NEU: 32.66%, since 7/29/06
DIOD: -5.75%, since 10/21/06 *currently the only down stock among longs

*11 Stocks (longs) have been cut for slight gains and/or small losses over the past couple of months which gives the index a 56% win-loss ratio in 2006. Twelve short candidates live on the MSW Index with two of them recently covered for losses.


Piranha

Labels: ,

Monday, October 23, 2006

Strongest NH-NL Ratio Reading in Months

The NH-NL ratio surpassed its strongest weekly level since May 6, 2006 when it closed at 503-74. This was the tenth consecutive positive weekly ratio with new highs closing at 442 and new lows dropping below 30 for the first time in 2006. The weekly lows averaged 29 per day which gives us the lowest reading since the week ending July 30, 2005 when the market averaged exactly 28 new lows per day. The NH-NL ratio chart shows that last week gave us the highest reading (87.69%) since the week ending January 14, 2006 (87.97%). The past two weeks have spent time above the positive 80% calculation that I have explained on past blog entries (links below). The NH-NL ratio has gained strength for the past 10 weeks according to the number of new highs versus the number of new lows and is looking like a similar pattern to 2005.


Monday had a total of 636 new highs, the most new highs in one day since Monday, May 5, 2006 when the daily ratio closed at 745-38. The ratio continues to gain strength and individual leaders are moving higher (stocks on our MSW Index and the IBD 100) but many secondary indicators are suggesting that the market is still extended. The main secondary indicator that I follow is the number of stocks trading above their 50-day moving average on the S&P 500. It closed at 80.80% after reaching an intra-week high of 85.20%, the highest reading since the January 2006. The market didn’t peak for another four months after reaching the level above 80% in January and this is why the indicator remains secondary. When the NASDAQ finally turned, the percentage of stocks above their 50d- m.a. was closer to 65% in early May (it dropped below 50% the following week while the market took a plunge).

To calculate the percentage correctly, use this formula:
(New Highs – New Lows) / (New Highs + New Lows) * 100 = X%


Where do the Major Indexes stand in 2006?
NASDAQ: +6.21%
DOW: +11.99%
NYSE: +12.23%
S&P 500: +9.64%

Below is an updated look at the weekly averages for the NH-NL Ratio:
Saturday, January 14, 2006: 500-32
Saturday, January 21, 2006: 348-46
Saturday, January 28, 2006: 516-46
Saturday, February 4, 2006: 449-44
Saturday, February 11, 2006: 229-57
Saturday, February 18, 2006: 306-42
Saturday, February 25, 2006: 420-36
Saturday, March 04, 2006: 399-49
Saturday, March 11, 2006: 162-84
Saturday, March 18, 2006: 459-53
Saturday, March 25, 2006: 312-52
Saturday, April 01, 2006: 441-39
Saturday, April 08, 2006: 481-58
Saturday, April 15, 2006: 150-103
Saturday, April 22, 2006: 540-75
Saturday, April 29, 2006: 353-76
Saturday, May 6, 2006: 503-74
Saturday, May 13, 2006: 384-116
Saturday, May 20, 2006: 64-211
Saturday, May 27, 2006: 57-182
Saturday, June 3, 2006: 119-93
Saturday, June 10, 2006: 72-204
Saturday, June 17, 2006: 41-310
Saturday, June 24, 2006: 56-238
Saturday, July 01, 2006: 127-198
Saturday, July 08, 2006: 143-95
Saturday, July 15, 2006: 74-273
Saturday, July 22, 2006: 66 - 307
Saturday, July 29, 2006: 163-151
Saturday, August 5, 2006: 194-132
Saturday, August 12, 2006: 88-210
Saturday, August 19, 2006: 178-96
Saturday, August 26, 2006: 140-74
Saturday, September 2, 2006: 285-42
Saturday, September 9, 2006: 143-60
Saturday, September 16, 2006: 244-75
Saturday, September 23, 2006: 206-83
Saturday, September 30, 2006: 251-75
Saturday, October 7, 2006: 301-92
Saturday, October 14, 2006: 412-40
Saturday, October 21, 2006: 442-29 - This Week

Tuesday, September 19, 2006
NH-NL Ratio still Neutral

Monday, September 04, 2006
Looking at the Market through the NH-NL Ratio

Monday, August 14, 2006
New Highs and New lows telling a Story

Piranha

Labels:

Tuesday, September 19, 2006

NH-NL Ratio still Neutral

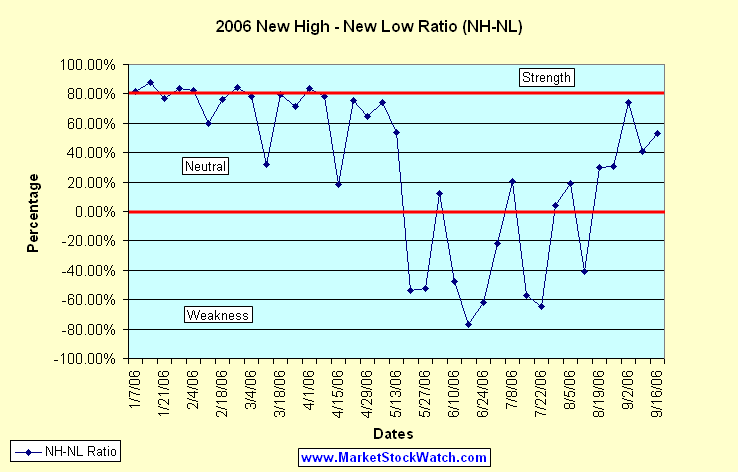
After a great response to the weekly market review I added on Friday, I felt it was necessary to update the NH-NL ratio chart to show how this indicator feels about the market. We have had five consecutive positive weeks for the first time since April 2006 but we are hovering in a neutral zone near 40% with a brief spike above 70% a couple weeks back. The month of April 2006 averaged 64% while the first week was in bullish territory above 80%, something we haven’t seen since.


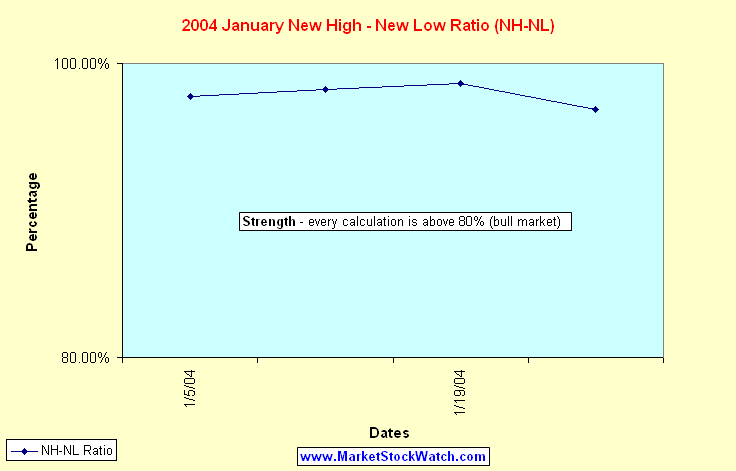
I often get a question about the difficulty of this calculation to stay above 80% and I respond with the ratios from 2003 and 2004. Below is a sample of the data extracted from January 2004 when the ratio averaged 97% for the entire month. The readings were as follows (chart below):

Sunday, January 4, 2004: 892-10 (97.78%)
Sunday, January 11, 2004: 792-7 (98.25%)
Sunday, January 18, 2004: 896-6 (98.67%)
Sunday, January 25, 2004: 505-8 (96.88%)


Where do the Major Indexes stand in 2006?
NASDAQ: +1.38%
DOW: +7.81%
NYSE: +8.21%
S&P 500: +5.84%

Below is an updated look at the weekly averages for the NH-NL Ratio:
Saturday, January 14, 2006: 500-32
Saturday, January 21, 2006: 348-46
Saturday, January 28, 2006: 516-46
Saturday, February 4, 2006: 449-44
Saturday, February 11, 2006: 229-57
Saturday, February 18, 2006: 306-42
Saturday, February 25, 2006: 420-36
Saturday, March 04, 2006: 399-49
Saturday, March 11, 2006: 162-84
Saturday, March 18, 2006: 459-53
Saturday, March 25, 2006: 312-52
Saturday, April 01, 2006: 441-39
Saturday, April 08, 2006: 481-58
Saturday, April 15, 2006: 150-103
Saturday, April 22, 2006: 540-75
Saturday, April 29, 2006: 353-76
Saturday, May 6, 2006: 503-74
Saturday, May 13, 2006: 384-116
Saturday, May 20, 2006: 64-211
Saturday, May 27, 2006: 57-182
Saturday, June 3, 2006: 119-93
Saturday, June 10, 2006: 72-204
Saturday, June 17, 2006: 41-310
Saturday, June 24, 2006: 56-238
Saturday, July 01, 2006: 127-198
Saturday, July 08, 2006: 143-95
Saturday, July 15, 2006: 74-273
Saturday, July 22, 2006: 66 - 307
Saturday, July 29, 2006: 163-151
Saturday, August 5, 2006: 194-132
Saturday, August 12, 2006: 88-210
Saturday, August 19, 2006: 178-96
Saturday, August 26, 2006: 140-74
Saturday, September 2, 2006: 285-42
Saturday, September 9, 2006: 143-60
Saturday, September 16, 2006: 244-75 - This Week

Piranha

Labels: