Market Talk with Piranha is currently moving to its new home at chrisperruna.com. The new site is up and running but many of the posts need editing as the images and stock charts did not transfer successfully (thanks blogger). I will post all new entries to both blogs – Thank you for your patience while I make this change!

Friday, June 30, 2006

Mid-Year Rally?

Thursday's move was powerful and it was powerful on several levels. I say this because the new highs list on the daily screen is the strongest I have seen since the end of March. The MSW Index stocks were simply amazing and have a 5% gain for the week (a total of 14 stocks – 8 of them are up more than 6% with two in double digits). Several stocks we have been following together over the past several weeks broke out or moved to new highs, many on above average volume – a sure sign of accumulation. The Fed raised the rate by 25 basis points to 5.25%, the 17th in the past two years but also gave investors an idea that they may slow the aggressive hikes in the future. Remember, the market typically prices-in future news six months in advance so we may be starting to see the positive move we want six months before the Fed stops raising rates. HOWEVER, I will not base that assumption on one day of strong moves with strong volume but everything starts somewhere and today is that kind of day.


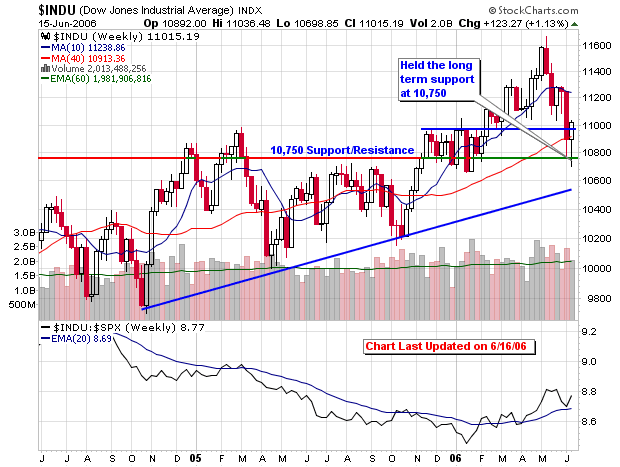
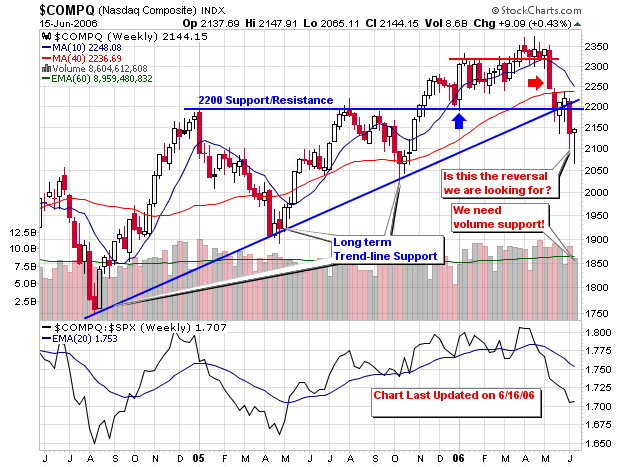
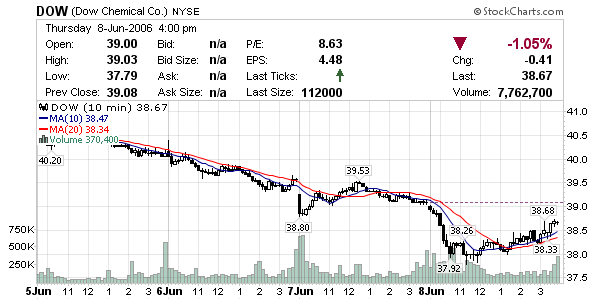
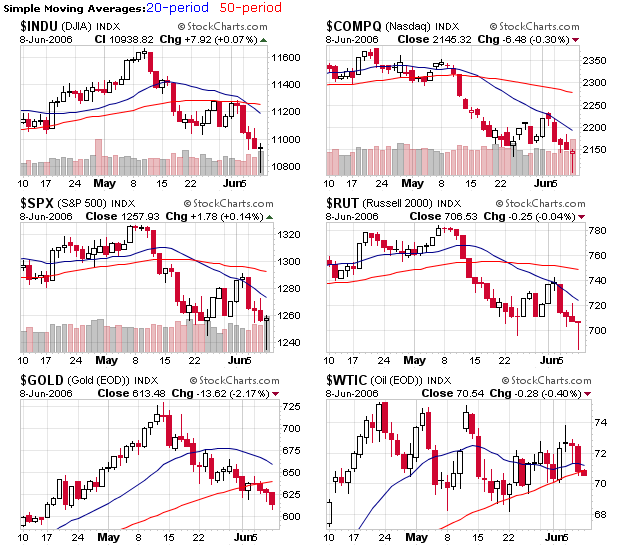
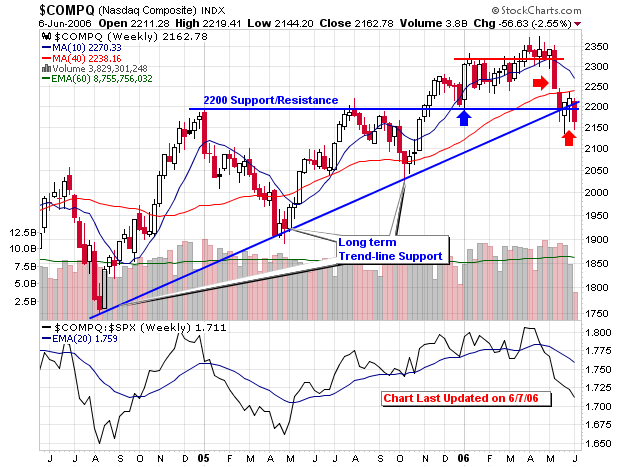
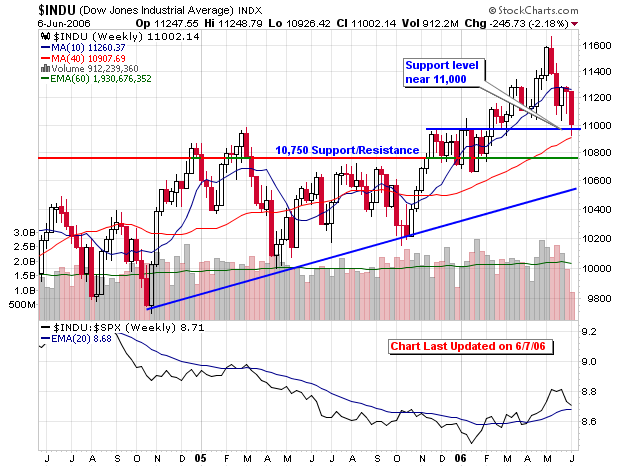
The NASDAQ was up 3% on volume 35% larger than yesterday while the DOW was up 2% on volume 26% larger than yesterday (the first major accumulation day in weeks, if not months). We never undercut the previous low set before the attempted rally so technically this can be a follow-through even though I marked it dead on Wednesday. I will now look for an additional follow-up move to confirm this move but the stop sign has been lifted for buying stocks. If you decide to start placing positions, please continue to use caution and strict selling rules so you don’t get whipsawed and lose a large amount of money in a short period of time. Use the proper position sizing techniques based on the size of your portfolios. Today was the largest daily gain for the DOW since April 2005, the largest for the NASDAQ since March 2004 and the largest for the S&P 500 since October 2003.


Another solid sign was the NH-NL ratio which recorded its first positive ratio (186-126) in 19 trading days (31 of the past 33 days have been negative).


So, how do we know if this is a true rally? The next step is to watch the leading stocks and start to place some test buys (about 1/3rd your typical position size) and see what happens. If you make money, the rally is telling you something, if your positions turn against you, it may be another bluff. I don’t know the answer but I will soon enough as I will be placing a few test buys. Depending on the action in the market tomorrow, I could be writing a great weekly analysis and updated MSW Index. Days like today are fun and I have been waiting for something like this to happen for a long time. I go on vacation Saturday but I am definitely bringing my laptop so I am able to watch the market and make moves next week.


As the Stock Trader’s Almanac states: the NASDAQ’s mid-year rally from the end of June through mid-July is strongest. The NASDAQ has been averaging a 3% gain since 1987 from the end of June to the second week of July versus 0.1% for the entire month of July. History also states that the gains over the next four months will be solid if July provides us with huge gains. In any event, continue to follow the price and volume of the indexes, the NH-NL ratio and individual market leaders.


Piranha

Monday, June 26, 2006

New Lows still larger than New Highs

I dedicated a portion of this past Saturday’s weekly analysis to the NH-NL ratio; so I wanted to highlight the added chart that tracks the NASDAQ new highs and new lows at stockcharts.com. My weekly NH-NL ratio is compiled from IBD and stretched further than just the NASDAQ.

Prior to Today (Monday, June 26, 2006), the NH-NL ratio has closed in negative territory for 28 of the past 30 days, the longest streak over the past several years (since the bear market). The previous long streak from 2005 lasted 13 days during the month of October when we had three consecutive negative weeks. We have now had 15 consecutive negative days ending this past Friday, the weakest in years. Five of the past six weeks have been negative for the longest stretch of weakness since MSW has been publishing screens in early 2004. This is the longest negative NH-NL ratio streak since late 2001 and early 2002. With all of this weakness, I am amazed at how well the markets have held up compared to the bubble burst of 2000 and the strong bear market that lasted for a couple years from 2000-2002. This can only mean two things: the market still has more downside or the market has strength that will eventually show up with the DOW possibly making a new all-time high and the NASDAQ moving to new 52-week highs. Wow, I guess anyone can predict that (I took both sides of the coin).

Whatever is in store for us, we must follow the rules and wait patiently until the NH-NL ratio returns to positive territory, the market highlights new individual leaders and the major indexes recover their long term moving averages. Until all of this happens, I will remain in cash with a few long-term option positions. Even though I added several new names to the MSW Index, it remains strictly a watch list at this time.

Below is an updated look at the weekly averages for the NH-NL Ratio:
Saturday, January 14, 2006: 500-32
Saturday, January 21, 2006: 348-46
Saturday, January 28, 2006: 516-46
Saturday, February 4, 2006: 449-44
Saturday, February 11, 2006: 229-57
Saturday, February 18, 2006: 306-42
Saturday, February 25, 2006: 420-36
Saturday, March 04, 2006: 399-49
Saturday, March 11, 2006: 162-84
Saturday, March 18, 2006: 459-53
Saturday, March 25, 2006: 312-52
Saturday, April 01, 2006: 441-39
Saturday, April 08, 2006: 481-58
Saturday, April 15, 2006: 150-103
Saturday, April 22, 2006: 540-75
Saturday, April 29, 2006: 353-76
Saturday, May 6, 2006: 503-74
Saturday, May 13, 2006: 384-116
Saturday, May 20, 2006: 64-211
Saturday, May 27, 2006: 57-182
Saturday, June 3, 2006: 119-93
Saturday, June 10, 2006: 72-204
Saturday, June 17, 2006: 41-310
Saturday, June 24, 2006: 56-238 – This Past Week

As for new highs vs. new lows – here are the facts from last Week:
Monday showed a ratio of 59-240
Tuesday showed a ratio of 43-278
Wednesday showed a ratio of 64-192
Thursday showed a ratio of 59-227
Friday showed a ratio of 53-253

Another thing that I noticed on a combo chart (I first noticed this by Matthew Frailey) was the possible switch of favor from small caps to large caps in recent weeks. As you can see from the second chart (which tracks large caps versus small caps), large caps are starting to gain some strength by violating the trend line that dates back several years to the bubble burst. This is a secondary indicator that can be helpful but never use it alone or as a decision maker without first reviewing the price and volume of the market and the NH-NL ratio.


Piranha

Thursday, June 22, 2006

Expectancy explained through Poker

I have been taping the 2005 US Poker Championships on ESPN with my DVR because I love to watch Texas hold ‘em. Most of you know by now that I love to play the game too. As the episode ended last night, they put up a stat that caught my attention even though I was starting to doze off. I paused the show, wrote down the statistics and thought to myself that it would serve as an excellent example on expectancy.

As you already know, a positive or negative expectancy can be achieved in multiple ways and the number of losers versus the number of winners does not matter so much when considering them individually. The power of expectancy takes place when you combine the percentage of winners and the size of the winner versus the percentage of losers and the size of the losers.

For more on expectancy please visit this post.
Also check out my expectancy calculator.

Poker expectancy example (this relates directly to trading):
Nine players at the table
34 total hands were played in this round

Player A saw the flop 28 of 34 hands or 82% of the time
Player A won hands 16 out of 28 tries for a 57% winning percentage

Player B saw the flop 11 of 34 hands or 32% of the time
Player B won hands 4 out of 11 tries for a 36% winning percentage

Looking at these numbers and assuming that both players had equal chips (they were close), who do you think made more money during the round?

Most people would guess Player A due to the 57% winning percentage on 16 hands. Player B fails in comparison with only 4 wins, a quarter of the wins of Player A.

Well, Player A actually had a net loss of 5,500 chips
While Player B actually had a net gain of 10,000 chips.

So what is my point?

The point is that being more active or less active is not a way to guarantee success. You must formulate a positive expectancy system that balances the opportunities with minimal risk and maximum gain. Player B took on less opportunity but made the most of it when the opportunity arrived.

Player A was erratic and played several hands that gave him poor odds and this is what I see so many traders do when the market is weak such as now. They trade for the sake of trading and they lose. I told you yesterday that I haven’t made a trade in five weeks and I will not make one until I feel the right opportunities arrive. Until then, I battle my patience and stick to my rules so I don’t trade erratically and play the game for the sake of playing.

Now, to tie this into the current market, I want you all to look at the chart I posted on a couple forums yesterday and the daily screen last night. Several people jumped back into the market on the long side based on a “possible follow-through day” but I don’t see it and I will sit this hand out until I see the downtrend broken and the NH-NL ratio strengthened.

Piranha

Wednesday, June 21, 2006

Can the NASDAQ – Crude Oil Index predict Bulls & Bears

As many of you know, I have had a lot of time on my hands as the market has been trading in volatile patterns with a downward bias. The majority of my money has been parked on the sideline since mid-May with the exception of a few open option contracts (longer term plays). I have not made a trade in five weeks since the start of my vacation in late May and I have become very bored. It’s been tough writing nightly market analysis but I am doing my best to locate possible short setups, consistently monitor the mechanical screen and follow the few market leaders (I prefer to call them stocks with the best RS ratings and charts as no true leaders exist right now).

Using this free time, I have been comparing certain market indexes with other benchmarks that I have been following over the past 6-12 months. Two of these include the NASDAQ and crude oil (light contracts). Two charts are loaded to this blog post:


  • The first chart is a combination index that I created myself using Stockcharts.com advanced tools. It combines the average close of both the NASDAQ and crude oil contracts over the past 10 years with a 200-d moving average. As you can see, the progression of this chart has called every major up-trend and downtrend before it was about to happen. The gray line on the chart represents the actual close of the NASDAQ index over the past 10 years (this line varies from the combo index). The only major divergence between the combo index I created and the actual price of the NASDAQ is during the past 18 months (since crude has gone wild). The combo index continues to trade downward as the NASDAQ trades sideways to slightly upward.

  • The second chart compares the action among the NASDAQ and crude oil over the past 10 years without any special combination effect. As you can see here, both entities have been trending higher over the past 18 months. This is very different from the combo index in the first chart.


So how would I use this combo index?

It is a long term outlook index that seems qualified and prepared to call the next major up-trend for the NASDAQ. To do this, the combo line must cross back above the 200-d moving average with strength and consistency. It has not stayed above the 200-d m.a. for long periods of time since 2003, the most recent “up-trending bullish market”. Prior to 2003, we have not seen a true bull market up-trend with this combo index above the 200-d m.a. since 1997-1999. From mid 2000 on, the combo index has spent much of its time below the 200-d m.a. and we all know how the market has behaved since March 2000.

So, to answer a question I received about a recent comment on a blog post: yes, I do believe that crude oil must cool off before we can sustain a major bull rally and this combo index may prove my theory correct if it continues to trade accordingly. But then again, it is only a theory and I am not into predictions.

Enjoy the combo index.

Friday, June 16, 2006

Reviewing the Market Charts

The DOW was back above 11,000 with a 1.8% gain on volume that was close to yesterday’s average while the NASDAQ was up 2.8% on volume 6% larger than yesterday. Advancers led decliners by a 4-to-1 ratio on the NASDAQ as many familiar stocks joined the party.

This was the best gain for the NASDAQ since March 25, 2004, well before the official start of MSW, although I was running these screens on several internet forums. It was also the first back-to-back triple digit gain for the DOW in 18 months as all 30 DOW stocks ended higher (not that we follow these blue chips).

The S&P 500 gained 26.12 points for its best one day gain since Mach 17, 2003 when it gained just under 30 points. The gains were solid but the volume was lacking for an all-out accumulation day as the NH-NL ratio finally subsided a bit with a final tally of 57-124 (still negative but looks much better than the past week).

If you are wondering about a rally, today was the second day of a newly attempted rally with a follow-through targeted for Monday thru Friday of next week. The rally count reset after we hit a new low, lower than the previous rally attempt. I told you that July was the only bullish month of the summer so I wouldn’t be surprised to see a move heading into next month. Don’t jump in early but start to review the stocks on the daily screens and look for candidates that consistently show up every night. I am doing the same and looking to start with a fresh batch of stocks for the MSW Index.

This next chart is one that is used by Trader Mike, a trader I have spoken about in the past, who I respect. It is the % of stocks above their 50-day moving average (it gauges the strength among the individual stocks on the index). I have never used this indicator but it seems very interesting so I will post it here for the first time. From what I understand, 20 and 80 are the extreme levels that can and sometimes do give buy and sell signals. For now, I will start to view it as a secondary indicator with relation to the NH-NL ratio I use. I would like to observe it for myself for a period of time before influencing decisions based on the action of the chart.

Finally, crude oil is still above the support area of $70 and until this breaks, I don’t see any major bull markets in the near future. Just an opinion of mine (I do understand that opinions are worthless in the market)!

Piranha

Tuesday, June 13, 2006

Update: SWN short play

I spoke about a possible short position in SWN back in March on MSW and highlighted the chart analysis on this blog: SWN a Short?

I said: “The short position or put options can be placed (or bought) right now but I must warn that oil is still trading above its respective 200-d m.a. Unless oil cracks $60 and breaks below its own moving average, this play may not work out. If you initiate the position, make sure you use the correct position sizing techniques and protect yourself from a move to the up-side.”

Two things happened: oil didn’t violate $60 and is still above $70 a barrel and SWN was immediately in the red on my put options. Looking at my trade journal, this is what I wrote for the position:

“3/15/06: SWN Sep, 2006 35 put, shares price: $31.18, option price: $6.20, looking for moving average breakdown or drop to $20”

Monday’s price closed at $25.88 (with the options trading at $9.60 per contract), its lowest level in a year (the stock did exactly what I anticipated over the six month stretch even though it looked like a bust during the first few weeks). If this was pure stock short, I would have covered when it went against me but I never sold the options due to the longer term outlook I took (6-month window). As many of you know, I typically purchase options for stocks in the $60-$100 run with a 9-12 month time frame (many of these options double or triple within the first few months and I close the position long before the 12 month expiration). Tenaris was a great example as I closed the options above $37 (from $12) and then went on to watch them soar to $97 per contract.

This position is one bright spot for me in the midst of everything happening in the weak market environment. These contracts are now showing a 50% profit so I will start to contemplate scaling out of the contracts and locking in gains today.

Piranha

Saturday, June 10, 2006

The “System” is not the Holy Grail of Trading

After reading a forum post earlier in the day, I was prompted to write this short entry. I always here amateur investors talk about that the “best way’ or “only way” to invest and argue why their way is better than everyone else’s. The passion and energy exuded by these beginning investors is wonderful but they are missing the point completely. No one can say that options are better than stocks, commodities are better than options and forex is better than everything, etc... Each investor develops a system that is suited to their own personal character traits and they use a vehicle (stocks, options, forex, commodities, real estate, etc…) that can help them reach their goals.

To say that one system or vechicle is the “way to go” is ignorant.

Pick up any Market Wizard book and read how these men and women made hundreds of millions in the markets using different systems. The only thing they all had in common was money management and risk management. That’s ALL! Every single one of them traded in different ways and used different vehicles but they all watched their risk and calculated proper position sizing techniques. Money management and risk management is the holy grail of investing, NOT THE SYSTEM!


Novice investors will eventually understand this after many years of trading (some quicker than others).

So, if someone ever tells you that their “system” is better, turn away and run and run fast because they don’t know what the hell they are talking about.

Here are some examples supporting my opinion from the Market Wizard books:

  • Michael Marcus turned $30,000 into $80 million trading futures
  • Michael Steinhardt ran a fund that averaged 30% annual return over 21 years trading stocks
  • Tom Baldwin started with $25,000 and eventually traded $2 billion a day in T-bond futures on the floor or in the pit.
  • Paul Tudor Jones ran funds that averaged triple digit returns for five consecutive years trading multiple markets
  • Ed Seykota realized an astounding 250,000% return over 16 years (yes that says 250,000%) managing accounts trading in the futures markets – possibly the best trader of our time
  • Bill Lipschutz traded currencies with a staring account of $12,000 (started out as an architect – very motivating for me since I started the same way).

The list can go on forever but my point remains the same – they all traded different markets from different locations (the floor, an office or their home in the mountains) but they all had one major factor in common: money management and risk management.


Just about every single market wizard refers to position sizing as one of the “holy grails” of trading. Van Tharp (also featured in Market Wizards) coined the phase in his book but he only realized that money management was the holy grail after studying and speaking with hundreds, if not thousands of very successful traders.

Piranha

Thursday, June 08, 2006

Market Reversal?

With rate hikes across the globe, the markets opened lower but stopped the bleeding around noon and started to construct an afternoon rally. The NASDAQ was down as much as 2.4% and losers were outpacing advances by a 5-to-1 margin but the reversal officially gave the market a day “1” count for an attempted rally. This time I will buy into the possible start of a rally but I will not “jump the gun” until I get a solid follow-through in one or more of the major indexes in the next four to ten days (preferably four to seven days). As IBD states (rules of William O’Neil’s CANSLIM), no major bull market has ever started without a follow-through from the initial day one attempt. I am not saying that this rally will work but I will take this move a bit more seriously than last week because I see many oversold indicators working together. Things can turn on a dime in the market and even though the NH-NL ratio and several individual market leaders got trounced, we can reverse for an attempted up-trend in less than a week. The DOW was up slightly on volume 38% larger than yesterday as the afternoon showed a nice surge in activity.

Even though the major indexes made solid reversals with spikes in volume, the NH-NL ratio weakened to its worst level of 2006 (49-371). Typical in 2006, we continue to see contradictory and conflicting data between the major market indexes and the “so-called” individual market leaders.

As you can see, day one of an attempted rally has passed and this is why it is very important to keep watch lists during poor market environments because we may have a buy signal within the next four to ten days.

Take a look at the first chart, it shows the daily reversal on the candlestick chart for the NASDAQ.

The second chart shows the NASDAQ in an intraday view with a nice mid-day reversal and afternoon up-trend with increasing volume.

The third chart shows the DOW from an intraday perspective as it mimicked the action among the NASDAQ.

Finally, I show a multitude of index charts that keep everything in perspective and show you that the market is still in a downtrend even though we may have witnessed a reversal.


Piranha

Wednesday, June 07, 2006

General Market Analysis: 6/6/06

A copy of the general market analysis I posted on MSW last night:

Every stock listed on the MSW Index was down today as the group fell 3.8% collectively with several doing so on above average volume. Sterling Construction (STRL) dropped the most with a 14.84% decline on volume 163% larger than the 50-d m.a. The two stocks that advanced yesterday, DXPE & LQDT, caught up to the rest of the field by dropping 5.53% and 8.17% respectively. The market is getting its ass kicked! Not the type of language I typically use but I need to make sure that I have everyone’s attention. I started to pull the community to the sidelines in early May and accelerated my campaign to cash throughout the month. If you are still being hurt on the long side by the recent declines, I suggest that you find something else to do with your money before it’s all gone. Every single indicator that the market has to offer has been telling to you to raise cash and move to sidelines until skies clear. If you are experienced enough to short stocks and play to the downside, excellent, but still use caution because this market cannot be trusted in either direction. It’s tough to just sit here and do nothing since I have been back from vacation but I am not crazy, I don’t like to lose money for no good reason other than boredom.

Looking at the broad market, we see the DOW fell to its lowest levels in months with a 16.1% increase in volume for another pure distribution day. The NASDAQ fell in higher volume to confirm a double bottom breakdown but it did attempt a rally towards the late afternoon (a strong final hour of trading). The NASDAQ remains below its 200-d m.a. as the DOW is above the long term moving average (recently fell below its 50-d m.a.) with a spread triple bottom breakdown confirmed on the point and figure chart today. The NH-NL ratio dropped to 50-253 today, confirming the weakness once again. With statistics like this, it is a waste of my time to upload screens that attempt to target stocks to buy. It is important to continue to watch the stocks with the best relative strength ratings but I will focus on possible shorts once again tonight.

Sectors with the most stocks making new lows included: medicals, building related stocks and retail stocks. Computer stocks have been getting slammed as well as several of these industry groups have fallen from mid-teen ratings to the bottom of the 197 member list in IBD (in less than three months). Speaking of IBD, they finally admitted that the market was in a downtrend rather than looking for this so-called rally or follow-through. I told you last Saturday that I was extremely skeptical of the follow-through they were looking for. Long term members of MSW understand that the NH-NL ratio will confirm a new up-trend so never jump the gun and buy before the rally is confirmed or when some other publication only suggests it could happen. I love IBD and I don’t understand why they gravitate so quickly to potential ups and downs; they never did this type of stuff five years ago.

Be safe in the market!

“Good judgment is usually the result of experience and experience frequently is the result of bad judgment” – Robert Lovell (quoted by Robert Sobel, Panic on Wall Street)

Based on my experience and judgment, I will stick to cash for now and wait patiently for the next move.

“Big money is made in the stock market by being on the right side of major moves. I don’t believe in swimming against the tide” – Martin Zweig

Piranha

Monday, June 05, 2006

Reversing Peter Lynch’s Thinking

I have wanted to write about this topic for many months but finally hit my boiling point after my experiences this weekend at the Home Depot. Peter Lynch likes to buy what he knows and what he uses (whether it is a specific hotel or new product). He once bought thousands of shares in a new hotel chain based on the great service, cleanliness and positive atmosphere he experienced while on business trips. The trade was very successful and his method was duplicated time and time again. I don’t trade like this but I wish I could reverse his thinking and short the hell of Home Depot (HD). I can’t tell you how many times I have walked into that place in a good mood but left angry based on the lack of help, professionalism and knowledge that these employees exude.

These big box stores have taken over the nation and we have lost the smaller, independent local stores that actually housed knowledgeable individuals that could help you with almost anything pertaining to their products or your own project. I specifically target Home Depot because it is 5 minutes from my house and I go there on a weekly or bi-weekly basis (forced to go since I don’t feel like driving 30 minutes to the closest local hardware store). Remember, I live in NJ, home to every chain store in America. It is bad enough that many of their employees don’t know much about the actual “how-to” to most projects but I can’t understand why they don’t even know where most of their products are located throughout the store. I don’t want to stereotype every Home Depot employee but the knowledgeable employees are few and far between.

A place like Home Depot stays in business due to the advantages they have when pricing items but I am willing to pay more to go to a place that can help answer some questions. My only problem with going to the small time hardware store is my time – I value my time and I don’t want to waste it driving in traffic for a round trip of one hour. The more I think about it, the more I figure it may be worth my time to only go to the small store when I have questions and only step into Home Depot when I know what I want and don’t have any questions. I may still have a problem because the employees might not know where the products are located so I will have to go on the usual scavenger hunt to find what I need.

Best Buy has the same problems when it comes to electronics but they have responded to some degree by integrating the Geek Squad to help with computers. I bought my most recent flat screen television at PC Richards based on the extensive knowledge of the salesman. Everything he said was right on cue and he helped us in many ways and allowed us to make an educated decision on which television would suit our needs best. For example: before meeting this guy, I didn’t know the difference between HDMI and component cables and how they affect the image and sound of the unit. Do you know how pissed-off I would be if I bought a system without HDMI technology. I don’t like “pushy” salespeople but I sometimes prefer them because they study the products they sell since it is directly related to their bottom line. Without commissions, they don’t get paid so their knowledge and customer satisfaction goes a long way. Many Home Depot employees could care less and I make this statement based on the fact that I have witnesses several of them using cell phones during work which I know is against their policies.

Now that I am done ranting, I tie this all together with the fact that Home Depot just signaled a descending triple bottom breakdown on the point and figure chart (a short term signal for a short position). If this was the old days and I was a major player, I would aim to take this stock down by gathering together a shorting pool. If investing was this simple, a kid would know what stocks to buy and what stocks to short (based on my life experiences at Home Depot, they should be out of business by now).

Piranha