Market Talk with Piranha is currently moving to its new home at chrisperruna.com. The new site is up and running but many of the posts need editing as the images and stock charts did not transfer successfully (thanks blogger). I will post all new entries to both blogs – Thank you for your patience while I make this change!

Saturday, April 29, 2006

ADVS Soars!

I made a blog post on ADVS 10 days ago recapping the coverage on MSW. I showed you how the stock was on the move and how the 200-d moving average play was making the anticipated move that I researched in early April.

As I wrote on the first day of coverage, and reiterated several times since, the short term target was a move above $34. Advent Software smashed earnings yesterday with a four fold increase and then awarded investors with a 12.17% advance on huge volume (volume was up 374% larger than the 50-d m.a.). The stock is now up 24% in less than a month on the MSW Index. I advise that protection be placed to ensure that your gains will be captured. I myself have placed a retracement stop (explained in a previous post and on the position sizing calculator).

Added to the MSW Index on 4/1/06:
"ADVS – 28.42, I bought the stock myself. I don’t know if it will work out but I placed money on the idea and have rules to protect the downside. As you have been noticing, I have been making several 200-d m.a. momentum buys in recent months. A twelve month price target will be from $38-$40 (FYI: I got in lower than the Index price as I bought on Thursday).

It will be interesting to see where the stock goes from here as I am looking at a short term target of $34 and a longer term target above $38 towards $40."

Piranha

Friday, April 28, 2006

100 R Profits come from strict Money Management Skills

If you ever wanted to understand money management techniques used by professional traders, I highly recommend that you read the book Trade Your Way to Financial Freedom by Van K. Tharp. The position sizing calculator that I uploaded to this blog is based from the book and several of the money management techniques I describe derive from the fundamentals outlined by Dr. Tharp. Other techniques such as technical analysis, fundamental analysis, market psychology and historical wisdom come from the small selection of books that I highly recommend: Recommended Stock Market Books.

I read a fabulous post on another blog yesterday that jumped right into the key money management subjects covered by Dr. Tharp. Trader Mike is a day trader, something I am not, but I respect the way he handles his trading and actually share many common techniques although in different time frames. I don’t know much about day trading but I understand money management and this post may help many of you delve deeper into the study of proper money management techniques. The blog post, My Path to 100 R in Profits from Day Trading , also shares a bit of his psychological thought process as the he explains why his returns were hurt slightly at one point last last year and how he will correct that going forward.

Whether you day trade, trend trade, swing trade or even buy and hold for longer periods of time; proper money management techniques are a must and understanding your own investor psychology is key to becoming successful. Enjoy!

Piranha

Wednesday, April 26, 2006

LifeCell Hits a New High

LifeCell (LIFC) raised its outlook for 2006 and earned $4.1 million, or 12 cents per share, up 91% from $2.1 million, or 7 cents per share, during the same period a year ago. Sales also jumped 54% to $30.7 million from the same period last year. Analysts (or talking heads) expected earnings of 9 cents per share with sales of $29.5 million.

I have been covering LIFC on the MSW index since February 4, 2006 at $22.13 with a breakout point of $24. As you can read below, we have been watching the flat base setup above the 200-d moving average over the past two months. Patience paid off once again as the stock broke-out today; up over 16% on volume six times the 50-day average.

Another text book breakout during the current earnings season! The MSW Index is on fire in 2006. The general market analysis will be provided tonight since I was excited over the breakout of LIFC.

The history of my coverage on the MSW Index is located below:

4/22/06
LIFC - 23.17
, A 4.75% gain this week as the stock moved up on higher volume than the previous week but stayed below average. The ideal entry and buy signal is still a strong move above $24. Rating: Hold

4/15/06
LIFC - 22.12
, Now a 14 week sideways flat base with the breakout on a move above $24 and a breakdown on a move below $20 (and the 200-d m.a. Rating: Hold

4/8/06
LIFC - 21.79
, I consider this a 13 week sideways flat base with the breakout on a move above $24 and a breakdown on a move below $20 (and the 200-d m.a. Rating: Hold

4/1/06
LIFC - 22.55
, I said it was a trend buy last week as it produced a return of 6.27% if you bought while it walked along the 200-d m.a. Still in buy territory with the next important move above $24.05. Rating: Hold - buy

3/25/06
LIFC - 21.22
, Walking along the 200-d m.a. (this is a stock that can be bought now as a trend-buy using the moving average). Rating: Can enter now at moving average (also building irregular base). Be careful with the medical stocks I have been screening lately!!!

3/18/06
LIFC - 21.45
, Walking along the 200-d m.a. (this is a stock that can be bought now as a trend-buy using the moving average). Rating: Can enter now at moving average (also building irregular base).

3/11/06
LIFC - 21.30
, Down 4% for the week with a 4% recovery on Friday on volume near average. Support was received above the 200-d m.a. this week with a close on Friday slightly above the 50-d m.a. Rating: Building a base

3/5/06
LIFC - 22.32
, A nice 5.28% gain this week on volume that was above average but below last week’s tally. A double top breakout buy occurs with a move above $24. Rating: Building a base

2/25/06
LIFC - 21.20
, Down slightly this week but still trading above the 50-d m.a. with the recent up-trend intact. Rating: Building a base

2/18/06
LIFC - 21.29
, A 3.10% move higher with the pattern still V-shaped base and a suggested buy above $24 on the P&F chart. Rating: Building a base

2/11/06
LIFC - 20.65
, The stock never gave a buy signal and is in a V-shaped base with a suggested buy above $24 on the P&F chart. Rating: Building a base with a target of $40 in 2006

2/4/06
LIFC - 22.13
, The stock makes the MSW Index as it gained 7.95% on the largest daily volume in months. Its chart pattern can be considered a cup shape but the P&F suggest a buy above $24. Rating: Building a base with a target of $40 in 2006

Tuesday, April 25, 2006

NutriSystem Gaining Weight?

Weight among investors that is! NutriSystem Inc. (NTRI) is up more than 33% today after the company easily beat earnings from the same period last year. Numbers reported yesterday showed an increase in earnings from $0.10 to $0.60 while revenue increased from $34.7 million to $146.7 million. Was this a surprise to MSW? Not really, considering the close coverage of the stock over the past couple of months. I have been covering the stock on the MSW index since February 25, 2006 with a target breakout area of $50 and a breakdown area of $35 (a number that was never hit).

After today’s advance on huge volume (I wrote about the after hours trading in last night’s daily screen), the stock now shows a 57% gain in two months on the MSW Index, adding another success story in the early months of 2006.

Below: Read the weekly analysis carefully and you will see that I called this one perfectly as it led up to today’s breakout explosion. By the way, the options I spoke about on 3/11/06 were worth $9.60 per contract back then – they jumped to $32 per contract today (a 233% advance in six weeks). As recently as April 15, 2006, I wrote this: “The good news: if it breaks $50, the buy is even stronger this time around. The more times it tests resistance, the stronger the potential breakout becomes.”

Finally, visit the blog post I wrote right here on Market Talk back on February 22, 2006:
Consider Timing when Buying a Stock

4/22/06
NTRI - 50.50
, We broke above the $50 resistance level but reversed from the high and closed at $50.50. The stock was up 11.43% for the week on the largest weekly volume since February. Rating: Hold

4/15/06
NTRI - 45.32
, After reaching $49, the stock couldn’t penetrate or even challenge the resistance level. The good news: if it breaks $50, the buy is even stronger this time around. The more times it tests resistance, the stronger the potential breakout becomes. Rating: Hold

4/8/06
NTRI - 46.95
, The small gain turned into a loss as Thursday and Friday sent the stock lower as it neared the resistance level and the top of our trading range. The next buy opportunity is a strong move above $50. Rating: Hold

4/1/06
NTRI - 47.52
, NutriSystem crossed above the $44.80 area without a problem and is now looking to make a new high breakout. Volume is up with a 9.62% gain this week but I would like the stock to slow down before making the possible move above $50. Patience in this stock may pay off as I maintained coverage during the correction. Rating: Breakout buy above $50

3/25/06
NTRI 43.35
, Back above the 50-d m.a. as the stock continues to make small gains quietly. Up 7% this week. It will be interesting to see if the stock can cross above $44.80 (the next peak number). Rating: Buy on new high (above $46 to $50)

3/18/06
NTRI - 41.04
, Up 7% this week as the options are looking good. September 06 calls are the selection but I wish I had longer options because I would be in those. Still trading in range $44.80 is the next critical number to pass) Rating: Buy on new high (above $46 to $50)


3/11/06
NTRI - 38.14
, I see something interesting here: Still trading in the range but the lows are becoming “higher lows”. Hit $32.37 in December, $35.01 in February and has only reached a low of $37.10 this month. If it doesn’t break lower than $35.01, the trend may resume higher. The P&F chart shows the higher lows formation. Rating: Buy on new high (above $46 to $50) – I’m looking at options here.

3/4/06
NTRI - 40.16
, Gave back 6.47% of the 10% advance from the prior week but volume was lower (still above average). A breakdown is a move below $35. Rating: Buy on new high

2/25/06
NTRI - 42.94
, Up over 10% as it recovered its moving average. I wrote a detailed blog on the stock earlier in the week and continue to remain on the bullish side. A buy happens with a new high above $50 on above average volume. At this time, it officially reenters the MSW Index. A breakdown is a move below $35. Rating: Buy on new high

Piranha

Higher Priced Stocks keep Going Higher!

I harp on this subject over and over but I do so for a reason. Most investors are still scared to buy stocks that are priced above $50 or $100 per share. They continue to reason with themselves that they could buy 1,000 shares of a $10 stock rather than 100 shares of a $100 stock. They like the idea that they own 1,000 shares and they focus on the possibility that the stock could double from $10 to $20 a lot easier than $100 to $200. I guess the joke is on them and I know that this is one of the reasons why many of these people continue to fail at investing in the stock market. It all boils down to false perceptions and lack of experience.

If you search this blog or the MSW archives, you will see that I have been covering Tenaris (TS) and Hansen Natural (HANS) for about a year. Every chance I get, I talk about these stocks because I have owned them both (multiple times). Most recenely, I wrote a blog post on March 3, 2006 that spoke about this same topic and compared the gains/losses in Tenaris and Sirius (a beloved lower priced stock that does nothing). In that last post, I showed you how Tenaris moved from $123 to $179 while Sirius moved from $7.12 to $5.08 in a three month period of time (ending 3/3/06). Since March 3, 2006, Tenaris has moved from $179 to $241 while Sirius has moved from $5.08 to $4.81 yet many of the Sirius speculators still believe that SIRI is the better investment over time. Really? They continue to sit there and WAIT for something to happen while other higher quality companies and stocks contine to push higher making their investors solid gains.

Another stock I wrote about on March 3, 2006 was Hansen Natural (HANS) when it was priced at $98.79 (a pre-split adjusted price of $197.58). I bought the stock near $66 (pre-split adjusted) and couldn’t care how large the prior advance was because the trend was still higher and I wanted to make a profit based on my analysis (not the height of the price). HANS is now trading at $140.05 (a 42% advance) in seven weeks (this comes after the several hundered percent advance over the past two years). Keep in mind that the pre-split adjusted price is now $280.10. The stock has gone from $66 to $280 since I first purchased it eleven months ago (no I haven’t owned it the entire way but I did establish postions at two ideal entry areas). Tenaris has gone from $50 to $241 over the past 12 months.

Another great example is Chicago Merchantile Exchange (CME); it has traveled from $200 to $500 over the past twelve months. You may say I am only picking out a few higher priced examples but that statement would be ignorant sicne I specialize in stocks traveling through the $60-$100 range and see dozens of stocks make the trek in a few months.

The morale of this post: Don’t ever make an investment decision based on the height of the price because you may miss a huge winner. Stocks can move from $100 to $200 just as fast as they move from $10 to $20; especially if the $100 stock is in a strong up-trend and the $10 stock is sub-par or trading in a downtrend. Take a look at the charts

Piranha

Wednesday, April 19, 2006

ADVS on the Move

Advent Software, Inc. (ADVS) is on the move today after an upgrade was issued earlier this morning. The stock is up over 6% in early morning trading on volume larger than the average. ADVS was added to the MSW Index three weeks ago at $28.42 as a 200-day moving average play (similar to STRL – up over 40% in two months as another 200-d m.a. play).

Below is the analysis over the past three weeks as the stock has been on the index.

4/15/06
ADVS – 28.18, up a penny this week as it continues to hold the 50-d and 200-d moving averages. The trend buy is now with anticipation of a short term move above $30 (towards $34). Hold (always sell on a breakdown below your sell stop – below the 200-d m.a.)

4/8/06
ADVS – 28.17, sitting on the 200-d m.a. on the weekly chart and slightly above the 50-d m.a. on the daily chart. A trend buyer could enter right now with anticipation of a move higher (similar to STRL). Rating Buy to Hold (always sell on a breakdown below your sell stop – below the 200-d m.a.)

4/1/06
ADVS – 28.42, I bought the stock myself. I don’t know if it will work out but I placed money on the idea and have rules to protect the downside. As you have been noticing, I have been making several 200-d m.a. momentum buys in recent months. A twelve month price target will be from $38-$40 (FYI: I got in lower than the Index price as I bought on Thursday).

It will be interesting to see where the stock goes from here as I am looking at a short term target of $34 and a longer term target above $38 towards $40.

Piranha

Friday, April 14, 2006

Position Sizing Calculator

Here is a link to a simple position sizing spreadsheet that I put together that also includes a few trailing stops (based on the retracement method explained in the previous post).

Position Sizing and Stop Calculator Spreadsheet

Try this link also for a direct download (people that don't use windows XP):
Position Sizing and Stop Calculator Spreadsheet


I will have a new page created and added to MSW with the calculator but this link should be sufficient for now. Click the button highlighted in the image to save the spreadsheet to your own computer.

Piranha

Wednesday, April 12, 2006

Taking Profits and Setting Exits

Most investors and many more market pundits continually talk about setting stops; they range from physical stops to mental stops to trailing stops to support stops to retracement stops or even moving average stops. It is easy to set a stop before you enter a position based off of your money management rules such as position sizing and expectancy. If you have a $25,000 account and want to risk 2% of the account on a $50 stock with an 8% stop; we know that the trade will allow you to buy 125 shares with a worst case scenario sell stop of $46.00 (assuming a 1-R risk of $4). This is wonderful but what should a trader do once the position gains 20%? Where should the stop be placed at that point to eliminate the chance of losing that quick 20% gain?

Several books attempt to explain how to take profits and many traders of the past have offered advice in books but most of it is fluff and subjective to opinion. I have heard people claim that they take a third of the position down after making a 20% or 30% gain while other traders take down half the position once a gain reaches 50%; but is this the correct way to manage money and positions? I thought so several years ago but have developed a more mechanical system that gives me precise exits at any time during an up-trend. It is a combination of a trailing stop and a retracement stop based upon the actual gain at any point in time. In a bull market, I will allow the system to loosen itself so I can handle a healthy pull-back without selling before a possible large move. For now, let me focus on my method for locking in profits without giving back too much.

For the sake of this article, I will continue to use the trade suggested above as the round numbers should be easy to follow.
Account Size: $25,000
Risk: 2%
Stop Loss: 8%
Share Price: $50

Shares to Purchase: 125 or $6,250
Sell Stop: $46.00
Worst case loss: $500 or 2%

If you are unsure how I came up with the numbers in this example, please go back and read these blog articles first:
Position Sizing - Why Losing Isn't Everything

Position Sizing Examples (simplified)

We buy the stock and it is up over 20% after the first three weeks of trading. What should I do to protect the profit I have already made?

Scenario #1:
At $60, I will set a stop based on a 30% profit retracement.
To do this, you need to multiply the profit of 20% (or $10) by a 30% stop: $10*30% = $3
At this point in time, I will look to close the position and lock in gains if the stock drops more than $3 from the $20% threshold ($60 in this case). My trailing stop is now $57 which guarantees me a total gain of 14%.

Scenario #2:
At $65, I will set a stop based on a 25% profit retracement.
As my profit grows, my stop tightens so I don’t give back too much. Again, this can loosen in bull markets and is also subject to longer term support and/or resistance lines. For the sake of this article, we will ignore all other variables.

To do this, you need to multiply the profit of 30% (or $15) by a 25% stop: $15*25% = $3.75
At this point in time, I will look to close the position and lock in gains if the stock drops more than $3.75 from the $30% threshold ($65 in this case). My trailing stop is now $61.25 which guarantees me a total gain of 23% if the trailing stop is violated.

Let’s do this one more time with a 40% gain:

Scenario #3:
At $70, I will set a stop based on a 20% profit retracement.
As my profit grows, my stop tightens so I don’t give back too much. As you can see from the three scenarios, my profit retracement has dropped by 5% as my profit has risen by 5%.

To do this, you need to multiply the profit of 40% (or $20) by a 20% stop: $20*20% = $4.00
At this point in time, I will look to close the position and lock in gains if the stock drops more than $4 from the $40% threshold ($70 in this case). My trailing stop is now $66 which guarantees me a total gain of 32% if the trailing stop is violated.

Please understand that I use these numbers since I like the separation of advances to be at least 10% from one retracement stop level to the next. Any investor or trader can substitute the numbers with something that makes more sense based on your own system and money management rules.

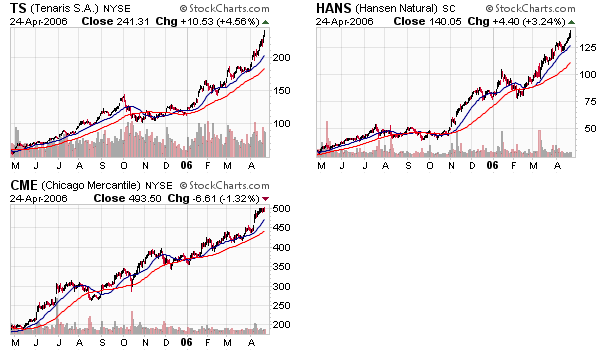
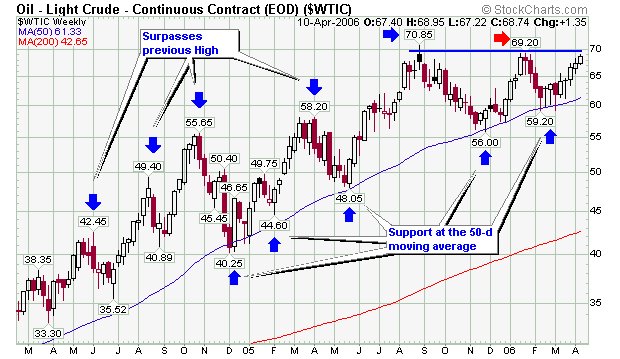
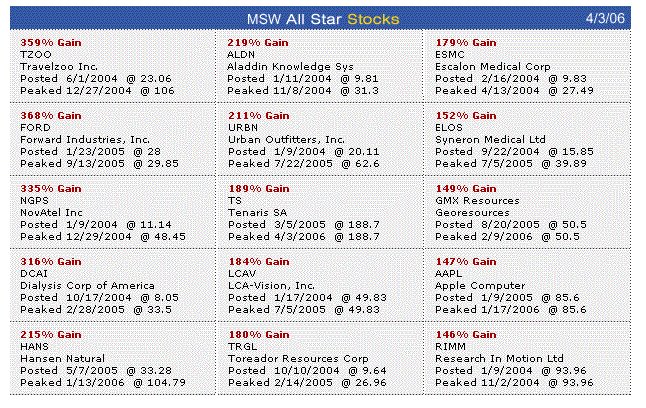
Outside of these selling rules, I also employ additional selling rules that use the long term 200-day moving average and long term support levels and trend lines. In a bull market, I will loosen the tight stops and look for longer term sell signals such as the moving average, a channel breakdown or even strong volatility movements that don’t agree with the overall pattern (these may be obvious reversals on the daily and/or weekly charts). Other times, I have a specific price objective when placing the trade and will close the position if the objective is reached (even if the trend is still higher). A great example of this are the options I purchased in Tenaris (TS); I sold at $45 per call contact, yet they are now trading at $80 per contract. I bought above $10 per contract and had an objective to sell when the stock reached $145 which it did, so I sold my calls and moved on. Looking back, I got out much too early but didn’t violate any of my rules which is more important than the additional gains. If I violated them on this trade and it worked out; what would stop me from violating them in the future and getting slammed with a heavy loss. I hope you get the point.

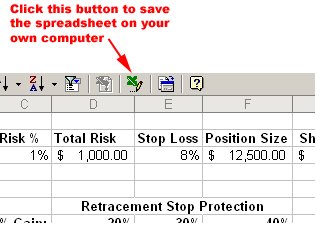
As I said last night, I am going to upload a simple excel spreadsheet that will allow you to play with position sizing setups and the type of stop that is described above. The stops are integrated into the spreadsheet to show you where to take profits and can be tweaked to your own parameters within your own system. Once I decide where to host the spreadsheet, I will post a link that will allow you to download it.

I will follow-up this article with anther in-depth article that uses a real time trade that I currently have in my portfolio to show you where I will close the position if the price drops. I hope to have the spreadsheet uploaded by that time so you can plug in the numbers to understand on a deeper level.

Piranha

Tuesday, April 11, 2006

Crude Oil Testing Highs & Resistance

I posted a blog entry last month about SWN and the possibility of a short based upon the overall trend of crude oil. That post can be found here: Southwestern Energy Short?

If you scroll down to the bottom of that entry, you will find a chart I uploaded of crude oil showing where the resistance plays a major role. If crude fails to make a new high without surpassing the resistance, I will start to look at several short term shorting opportunities within the sector (SWN being one of them). If SWN reverses and closes below the moving averages, the short will be on (in my case, I am buying put options to follow my idea).

This link takes you to an article that talks about the possible push to new highs for crude oil: Oil retreats to $68 after falling short of record

Piranha

Friday, April 07, 2006

Tower Group (TWGP) Breaks Out

Tower Group Inc. (TWGP) was up over 14% on volume 225% larger than the 50-day moving average as the stock broke out of the cup with high handle base; above the pivot point of $24.56. I have been covering TWGP over the past month and have listed the analysis I provided for TWGP on the MSW Index each week since March 4, 2006. The close above $26 takes the stock half way to the projected target of $30 I gave one month ago at $20.

The MSW Index has been on fire and stock after stock continues to breakout of properly formed bases giving all of us ample opportunity to take profits out of the recent run of individual stock leaders. There is no reason why MSW members should not have caught at least one of the several breakouts this past week as I have been covering them all since their bases were forming and their potential pivot points became apparent. Below is a quick history on the stock over the past month on the MSW Index (weekly screens).

The chart in this blog post also shows you that we started to cover TWGP last October but targeted the stock a bit earlier than I wanted. The stock never violated the pivot point from October but I cut the coverage from the MSW Index. When the recent base became apparent, I immediately placed the stock back onto the MSW Index before it took off with the recent 30% gain in 4 weeks.


  • 4/1/06:
    TWGP – 23.10, the slight drop is welcomed as we may be forming the start to a possible handle formation. The new pivot point is now $24.56 with support lower at the moving averages. Rating: The new buy is above the pivot point – CANSLIM rules
    3/4/06: 20.95


  • 3/25/06:
    TWGP – 23.39, Up another 6.71% this week as the stock managed to make a new all-time high. A handle hasn’t formed but the stock is up over 10% on MSW in three weeks. Rating: I would like to see a handle and exact pivot point to form


  • 3/18/06:
    TWGP – 21.92, up over 7% this week as the right side of the base looks to complete its formation and start a handle pattern. If a handle starts to form, we can target an exact entry area. Rating: look for cup base to build right side properly with handle

  • 3/11/06:
    TWGP – 20.37, the stock was down less than 3% this week as it closed sitting on the 50-d m.a. (gaining support on Friday). We may see a deep 9 week cup shaped base forming which would change the ideal entry point. Rating: look for cup base to build right side properly

  • 3/4/06:
    TWGP – 20.95, A former MSW Index stock for nine weeks from October 2005 to January 2006. When the correction started, we removed the stock from the index but it is back on recent strength and support. It was up this week on the largest volume ever! The buy is now with a target of $30 in the next six months.

Piranha

Thursday, April 06, 2006

MSW Mini-Screen: Top Stocks

Due the Mid-Week Special Screen on MSW last night, I promised members that I would post up a mini-screen that highlights some of the recent moves of our MSW Index stocks. Every one of these stocks has been actively covered since the initial coverage date listed below. As you can see, we have found many of the market leaders over the past several months as the major market indexes trend sideways to slightly higher. The MSW Index can hold up to 30 stocks at one time but has not held more than 25 all year due to the weakness in the NH-NL ratio (new high – new low ratio). The stocks listed below are among some of the top performers on the MSW Index in 2006.

The NASDAQ hit its highest levels in more than five years while the S&P 500 reached its highest level since May 2001. Volume increased on the NASDAQ, giving us an accumulation day but volume fell among NYSE stocks (mixed signals across the broader market). The NH-NL ratio surpassed 500 and 600 new highs this week on separate days, the first time the ratio has done this since January 26 and January 27, 2006. The week ending on February 2, 2006 did have three days surpass 500 new highs but none of them crossed above the 600 new highs threshold.

The completion to the mid-week special screen will be uploaded tonight on MSW in part II of the daily screen exercise. If SWN fails to recover the 50-d m.a. and then slices back below the 200-d m.a., I will be buying the put options I spoke about earlier in the week. Another stock we have been talking about recently , AAPL (the former MSW Index tenant), received strong support at the 200-d m.a. and then released news yesterday that users can now run Microsoft windows on Intel based Apple machines using boot camp software. The stock rocketed to the 50-d m.a. and then surpassed it in early trading today. The charts were telling us that support was coming from somewhere but we didn’t know why until yesterday. The charts always tell the story before it hits the wire and this is why I don’t trade the news (it’s usually too late). See you all tonight.

MSW Mini-Screen
All prices are from the close on Wednesday, April 5, 2006:

  • PMCS – 13.25, the stock was up more than 8% on volume 115% larger than the 50-d m.a. Now up 16% on the MSW Index since 3/4/06
  • OXPS – 31.00, up 6.9% on volume 58% larger than the 50-d m.a. as the stock recovered the 50-d m.a. Now up 42% on the MSW Index since 11/12/05
  • TS – 202.24, up 6.33% to top $200 for the first time. Up more than 64% on MSW since 12/2/05 when we re-covered the stock at $123. We started our initial coverage last year in the $60-$100 run on 3/5/05 at $65.24 (a 210% gain). Moving up on the all-time MSW All-star list. If you thought buying the stock in the base at $123 was high; what do you think now at $200?
  • STRL – 23.30, up 5.72% on volume 30% larger than the 50-d m.a. as the stock is now up more than 23% on the MSW Index since 2/4/06
  • LVS – 60.71, one of the most recent additions to the MSW Index as the stock is now up 7% in one week on the MSW Index (looking for a $60-$100 advance this year).
    HAL – 77.34, one of the few energy stocks left on the MSW Index as it has gained 5.92% this week and has a total gain of 17% on the MSW Index since 12/10/05
  • NETL – 42.03, the up-trend is still intact as the stock looks to make another new high. The total gain is now 78% on the MSW Index since the first day on coverage on 11/12/05 at $23.56 (only five months).
  • NWRE – 30.15, looking to breakout from the most recent cup shaped base (without a handle at this point) to a new high. The stock is now up 49% on the MSW Index since 11/5/05
  • NTRI – 48.76, I hung tight with NTRI as it corrected to the lower half of the trading range but held above the support at $35. It is now up 14% on the MSW Index since 2/25/06. Looking for a new high above the previous high at $50.00 set in late January
  • GEHL – 40.39, profiled right here earlier in the week and covered on the MSW Index since 2/18/05 at $31.45 (lower than the pivot point of $35.15). A huge breakout this week as the stock has gained over 22% for the week and 28% on the MSW Index
  • CBG – 80.70, the stock has now completed half of the $60-$100 run and is nearing a long term capital gain on the MSW Index since its initial coverage on 5/21/05 at $37.20 (a 117% gain).

Piranha

Tuesday, April 04, 2006

The Breakout of Gehl Co. (GEHL)

This is a question I received about GEHL earlier today:

Chris,

After the big breakout today, GEHL is still within 5% of the pivot
point. Would you recommend taking a position or has the opportunity
passed?

Thanks,
MSW Member

My Answer:
In a bull market, I would say to jump in if interested. In this type of market, I hesitate in giving that recommendation due to the large number of reversals among breakouts. If the stock reverses, you would be forced to sell quicker than usual. The stock is about 2% higher than our targeted pivot point of $35.15; so you are not chasing it too much from the ideal breakout area.

According to the rules (CANSLIM rules), it is still a buy. Place half a position if interested and watch what happens. If it works out, you can always add shares at a later date on a healthy pullback to the moving average. If you buy and it reverses, sell! Don’t worry about being right or wrong, worry about your risk and following the rules. If you follow the rule of cutting losses and letting the profit ride, the trade will take care of itself. Trade the idea and allow the money to do the talking.

Hope this helps,
Chris

Monday, April 03, 2006

Updating MSW Stocks

A small void has been left on the blog over the past several days due to my focus on the daily and weekly screens for MSW. After the death of a family member, I felt I needed to perform detailed analysis of the best possible opportunities according to my research for the members of the community. Now that the week is over, I will start to answer member questions on the blog, post up new articles, case studies and interesting stock market topics.

With March coming to a close (the end of the first quarter), I want to reflect on some of the stocks that I have been covering each and every week, specifically the successful MSW Index members.

MSW Index Stocks making moves in 2006:
OXPS – up over 33% since 11/12/05
NTRI – up over 11% in one month
TWGP – up over 10% in one month
TS – up more than 63% YTD
STRL – up 20% in two months
NETL – up over 75% in less than five months
PMCS – up about 10% in one month
NWRE – up almost 50% in five months
CAMP – up over 20% in March
HANS – up over 20% in the past two weeks (200%+ in 10 months on MSW)
LMS – up over 17% in the past week (former MSW All-Star)
CBG – up 37% YTD (up over 120% since covered on MSW last May)

Now compare the stocks above to the Major Indexes:
NASDAQ – up 6.23% YTD
DOW – up 4.48% YTD

Thirteen of the current twenty two members on the MSW Index have been added after February 1, 2006 with eight of those stocks added after March 1, 2006 and two of those stocks added after April 1, 2006. The Index is fresh with new faces and I look to add a new class of stocks to the MSW All-Star list by the end of 2006. Results are not guaranteed but no one can dispute the consistency I have had over the years covering many of the largest winners in the market.

The image in this blog contains the top 15 All-Star stocks that I have covered on MSW since 2004. A covered stock is one that appears each and every week on the MSW Index during its time on MSW, not a stock that appears once in 2005 and then once again in 2006. Besides, all of my 2004 and 2005 archives are being transferred into basic HTML pages for everyone to review. You can see how my research has expanded, evolved and formatted into what it is today. Anyone can now follow the coverage of a specific stock from week to week in the MSW archives. When we are done formatting the pages into HTML, I will generate a link on the blog that takes you to a quick pick page!

Piranha