Market Talk with Piranha is currently moving to its new home at chrisperruna.com. The new site is up and running but many of the posts need editing as the images and stock charts did not transfer successfully (thanks blogger). I will post all new entries to both blogs – Thank you for your patience while I make this change!

Monday, February 27, 2006

Five Month Triple Top Breakout?

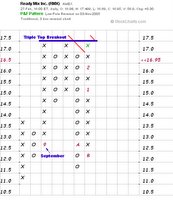
Ready Mix (RMX) was a stock that we started to target after the IPO last fall. We posted a case study on the member’s section of MSW on 9/20/05 with fundamental analysis and detailed chart analysis. The most interesting piece of the chart analysis was the breakout area that we targeted in September of 2005:

September 6, 2005 (first daily screen appearance):
RMX – 15.78, new IPO that provides ready mix to construction projects near Las Vegas.

September 10, 2005:
RMX was mentioned on a Secondary watch list on the Weekly Screen

September 17, 2005:
RMX makes the official watch list on the weekly screen at $16.60… Here were our comments:
“Young IPO that was mentioned last week and studied this week. The breakout would be a move above $17.50 on above average volume.”


As we start to watch Ready Mix (RMX) once again, we have come up with the exact same breakout point that we targeted five months ago before the recent basing pattern. The buy was never signaled back in September and I am not sure if it will happen this time around either but it was not a coincidence that the stock reached $17.50 intraday today and then retreated during the afternoon hours.

Take a look at the three charts posted in this blog:
The first is a combo from September 21, 2005 as the stock was just debuting on the exchanges as an IPO from August.

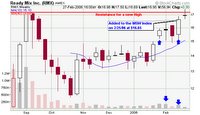
The second chart is from today as the stock is about to complete a five month basing pattern with the EXACT SAME TRIPLE TOP BREAKOUT from September.

The third chart is the Point and Figure that has the chance for a triple top breakout (starting back in September).

If the stock breaks-out from this triple top breakout, I would have to believe that I was the first one to call the buy back in September 2005 (I am joking with this statement).

Ratings in September 2005:
EPS: 79
RS: 92
Industry Group: 40 out of 197

Ratings today (2/27/06):
EPS: 95
RS: 84
Industry Group: 66 out of 197


Piranha

Wednesday, February 22, 2006

Consider Timing when Buying a Stock

NutriSystem (NTRI) shares are up more than 13% today after the provider of weight-loss products beat Wall Street's earnings expectations and offered a better-than-anticipated outlook. Last year, the company lost $605,000 or 2 cents a share in the fourth quarter. This year, the company posted a Q4 income of $6.3 million, or 17 cents a share, beating estimates by $0.01 as analyst were looking for earnings to come in at $0.16 a share. Revenue also jumped considerably from $7.9 million to $69.7 million (analysts expected $69.5 million).

Looking ahead, NTRI predicts earnings of $0.40 to $0.42 cents a share while analysts predict $0.37 (a main factor weighing into the 13% jump in earnings today). Company projections for revenue also come in higher than analyst’s projections ($122 - $127 million versus $117 million). This is the big difference between a stock like (NTRI) and (RNOW). RNOW also crushed earnings a couple of weeks back but the future expectations came in lower than analysts projections so the stock did not breakout. For further analysis on the RNOW failed breakout, see this blog post.

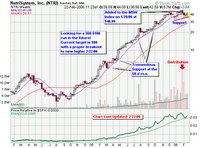
On 1/28/06, I added (NTRI - $46.99) to the MSW Index and said this:
“Added to the Index after it broke out above $45. The stock traded sideways for nine weeks in what I call a consolidation. It reminds me of HANS and TS when they made their great runs from the single digits to $100 per share. Target is $80 in six months.”

Two weeks later, the stock violated the MSW Index 10% mandatory sell rule so it was removed officially from the Index BUT I said this and kept it in it’s spot on the Index (unofficially as a watch candidate):

Analysis from Weekly Screen on 2/11/06 (NTRI - $38.95):
“The stock was a sell for anyone that bought at the former levels but I am not convinced in removing it from the Index because I see some support. Technically it is removed from the MSW Index as I have removed the date and % gain/loss. It has a chance to officially re-enter the MSW Index if it sets up another buying opportunity.”

This past Saturday, I went on to support my original feeling that this stock was receiving support and I may still be wrong but today’s 13% jump supports my original analysis:

Analysis from Weekly Screen on 2/18/06 (NTRI - $38.96):
“Down a penny this week as I will allow the stock to stay on the MSW Index as a watch candidate (not a buy candidate at this time). Some investors actually look at this stock as a shorting candidate and they may be right but I am not in that boat right now. I still see the possibility of a move higher after this sideways correction phase is over. Time will tell (for now – watch from the outside).”

What is the moral of this post?

Sometimes you may find a stock and research it and discover that it has upside potential and buy but get in at the wrong time. You may be forced to sell but that doesn’t mean that your original analysis was wrong. Don’t give up just yet, hang tight, take the small loss and watch the stock on the side to see if your timing was wrong. If the timing was wrong and the stock is acting strong again, place another position and follow the rules (especially your sell rules). If it violates the rules again, sell for another small loss. If it takes off and shows a profit, you will be very happy that you didn’t miss out on a big winner because your first trade was placed at the wrong time.

Over the next few weeks and months, we will see if NTRI will make the next run I originally anticipated!

Piranha

Tuesday, February 21, 2006

Position Sizing Examples (Simplified)

Question on Blog:

Hey Chris,

This post is great. It has really helped me to comprehend the concepts of risk management. I had one question though. Do you advocate holding relatively few investments (5-8) or more? I noticed that in the example with the $100,000 portfolio, the amount of capital used on a single position was $4,000. This would equate to roughly 25 positions in all. Do you think it would be smarter to invest more capital in fewer positions if you are only starting out with, say, $5,000-10,000?

My Answer:
What the reader is saying is only true to a certain degree. Let me show you several examples of buying the same stock with a 7%, 15% and 25% sell stop in place with two different size portfolios. The number of shares change but the risk stays the same.

In the first set of examples I will use $10,000 and then $5,000 for the second set of examples. In these examples, I will use the simplified approach discussed by Brian Hunt from my first post. Please note that these examples don’t consider other variables such as slippage, etc. Please read the book by Van K. Tharp to study the detailed models of position sizing. I will also note that it is very difficult to employ this position sizing strategy with only a $5,000 stake. In my own experiences, I only bought one or two stocks when my portfolio was starting out with less than $10,000. Besides, I didn’t know about position sizing ten years ago!

Example #1:
Stock XYZ is trading at $25 per share
Portfolio size of $10,000
Risk Model of 3% per trade (due to a small account)
The stop loss is 7%

Risk will be $300 = ($10,000*3%)
Amount to Trade at 7% stop: $4,285 = ($300 / 7%)
Shares to be bought: 171


Example #2:
Stock XYZ is trading at $25 per share
Portfolio size of $10,000
Risk Model of 3% per trade (due to a small account)
The stop loss is 15%

Risk will be $300 = ($10,000*3%)
Amount to Trade at 15% stop: $2,000 = ($300 / 15%)
Shares to be bought: 80


Example #3:
Stock XYZ is trading at $25 per share
Portfolio size of $10,000
Risk Model of 3% per trade (due to a small account)
The stop loss is 25%

Risk will be $300 = ($10,000*3%)
Amount to Trade at 25% stop: $1,200 = ($300 / 25%)
Shares to be bought: 48


Now I will change the parameters to a 2% risk model with $5000 in the account:

Example #1:
Stock XYZ is trading at $25 per share
Portfolio size of $5,000
Risk Model of 2% per trade
The stop loss is 7%

Risk will be $100 = ($5,000*2%)
Amount to Trade at 7% stop: $1,428 = ($100 / 7%)
Shares to be bought: 57

Example #2:
Stock XYZ is trading at $25 per share
Portfolio size of $5,000
Risk Model of 2% per trade
The stop loss is 15%

Risk will be $100 = ($5,000*2%)
Amount to Trade at 15% stop: $667 = ($100 / 15%)
Shares to be bought: 26

Example #3:
Stock XYZ is trading at $25 per share
Portfolio size of $5,000
Risk Model of 2% per trade
The stop loss is 25%

Risk will be $100 = ($5,000*2%)
Amount to Trade at 25% stop: $400 = ($100 / 25%)
Shares to be bought: 16

Piranha

Monday, February 20, 2006

Position Sizing & Risk Management

One of our fellow MSW community members wrote a great article on his blog about position sizing and I wanted to bring it to everyone’s attention:
Risk Management - Position Sizing

His main page can be viewed at:

Trend Following with CANSLIM

Since I am on the topic of blogs, I have been meaning to invite the community to read Jon Tait’s blog, Fickle Trader, someone I have formed an “investment relationship” with over the years. We met on the Richdad forums and have kept in touch ever since (we have some great conversations through e-mail about trading). He may refer to me as his mentor (way too much flattery) but I am sure he will be mentoring many more than I in the future while making (trading) his millions in the market.

Below is another simplified example of a specific position sizing method (for further reading on the subject, visit the book by Van K. Tharp that I mentioned on a recent post titled Sound Money Management Key in Trading:

Example:
Let's say you have $100,000 to invest and you're using the 1% risk model to guide your investments. If you're using a 25% stop loss, you could buy $4,000 worth of stock and risk $1,000 ($1,000 is 1% of $100,000).

In the example above, you placed 4% of your portfolio into the stock and set a 25% stop—risking just $1,000 of your money (since $1,000 is 25% of $4,000).

Some investors use even tighter stops, in the 10%-15% range.

If you're using the 1% risk model with a 10% stop loss, you could buy $10,000 worth of stock. You have the same dollar amount at risk ($1,000) as the first example - but you're allowing the stock less room to go down before you sell.
Written By: Brian Hunt

Piranha
p.s. - keep in mind that the markets are closed today!

Friday, February 17, 2006

Question about Earnings (GES)

MSW Member Question:

Hi Chris,

My name is Joe and I am a member of MSW. I have a question that I really don't understand. I am currently holding Guess (GES) and today it has an earning CC saying earnings beat estimates by 0.08/share. However, the stock dropped 10% with 800% more volume than average. The same situation happens to LMS where it dropped 20% with great earnings. Is there something wrong with the report that I have to pay attention to? Thanks for the advice.
(Actual member’s name has been changed for privacy)

My answer:

Two things you need to understand:


  1. Current stock prices reflect actual or anticipated news and earnings from the past six months so the great earnings release today was already priced into the stock.
  2. Future expectations and earnings will be priced into the stock today after the release based on the projections. All future moves of this stock will be based on the expectations at the next earnings release (essentially, the stock price is foreshadowing the price six months from now).

In the case of your stock, Guess (GES), it crushed earnings:

Q4 EPS Increased 73% Versus Q4 Last Year, $0.57 Versus $0.33
2005 Net Earnings Doubled Over 2004, $58.8 Million Versus $29.6 Million


Fourth Quarter Highlights
- Net revenues increased 23.5% to $276.6 million
- Comparable store sales up 15.9%
- Gross margin increased 310 basis points to 42.6%
- Earnings from operations up $17.3 million to $43.4 million
- Net earnings increased 74% to $25.8 million


2005 Highlights
- Net revenues increased 28.4% to $936.1 million; comp store sales up 9.2%
- Gross margin increased 310 basis points to 40.7%
- Earnings from operations reached $101.8 million
- Net earnings doubled to $58.8 million

Sounds great, right? WRONG. These numbers have already been priced into the stock. The stock broke out about six months ago above $25 as shown on the chart above. That was the proper time to get into the stock as it was trading on future expectations. Stocks move ahead of the news and not on the announcement of the news unless it’s extremely positive or negative (or a complete surprise).

Thursday’s 13% drop represents future expectations of the company and not the earnings that were released yesterday (again- they have been priced into the stock over the past six months). Here is the culprit of the recent drop in price:

LOS ANGELES, Feb. 16 /PRNewswire-FirstCall
Guess? Inc. today reported record financial results for the fourth quarter and fiscal year ended December 31, 2005. Net revenue and net earnings for the quarter and the year were at their highest levels since the Company went public in 1996.

Guess Inc. shares declined Thursday after the jeans and fashion retailer warned of moderated first-quarter sales growth. Stock of the Los Angeles-based company fell $6.05, or 13 percent, to close at $40.15 in heavy trading on the New York Stock Exchange.

For the first quarter, Guess expects same-store sales, or sales at stores open a year or more, to rise 10 percent. The company expects overall sales to rise in the mid-teen percentage range, a slower rate of growth than in the last couple of quarters.

Wall Street had expected revenue of about $249.6 million, about 16 percent higher than revenue of $215.6 million in the prior first quarter.

On a conference call, Chief Operating Officer Carlos Alberini noted the snowstorms in the Northeast and the occurrence of Easter in April in 2006, rather than in March a year earlier, would hurt comparisons.

For the month of March, for example, Alberini expects same-store sales to be "nearly flat," according to a transcript provided by Thomson StreetEvents. For the second quarter, the company expects same-store sales growth of 10 percent.

******************
As you can see, the current price drop reflects future growth and expectations and they seem to be flat so investors grabbed their profits and ran. The stock did manage to close above the 50 day moving average and it will be interesting to see if it holds support above this line (it has since the breakout above $25). The minute investors heard that the stock will not meet analysts expectations, they sold and ignored the great news from last year because they know that those profits have already been made.

An old Wall Street saying goes like this:
“Trade the rumors and sell the news”

Six months ago, the rumor was that this company was going to beat earnings expectations so investors started to buy. Now the rumor states that they won’t beat expectations, so they sold the news!

Piranha

Wednesday, February 15, 2006

MSW Index Top 20 Stocks from 2005

I have started to compile the complete results of the MSW Index and the MSW weekly screens throughout 2005 and have developed the top 20 list for your viewing on the blog. Click the picture at the bottom of this page to view the chart of the top 20 stocks from 2005. You will notice that 8 of the top 20 stocks are still active on the current MSW Index and several of the stocks with coverage initiated during 2005, ended their runs in recent weeks.

In the coming days, I will be uploading an exclusive page to MarketStockWatch.com that highlights the top stocks throughout the year, the worst stocks picks throughout the year, the ratio of winners to losers on the Index, our top shorting opportunities last spring and other important information about the stocks we covered in 2005. The next lists to appear on this blog will be the top shorts of 2005 and MSW’s biggest busts in 2005.

- As you all know, every trader has many busts throughout the year but the greatest traders learn to sell these stocks before they do further damage. As for the MSW Index; any stock that drops 10% from the initial coverage point is automatically cut!

Enjoy,
Chris Perruna “Piranha”

p.s. – Notice how many of the top stocks were covered week in and week out for 20 or 30 weeks (many consecutively) as they made their huge advances to profitability. (make sure the image opens to full size to read it properly)


Monday, February 13, 2006

Snow, Futures and Options

This post is non-stock related but I thought it would be cool to post a picture of my dog playing in the blizzard yesterday since snowfall totals can make investors money. How? I will explain that below!

Many of the readers of this blog come from other parts of the country and even other parts of the world. We received about 22” of snow in a 15 hour period. We did not set the snow record in my town as we are in the suburbs and have had storms reach 30” or more but it was the all-time record at 26”+ in NYC.

My wife named our dog Bob! I call him Buddy Bob or Bobby.

Since it did snow, I figured I would link this image of my dog playing in a lot of snow with something that many of you may not know:
Weather futures can be traded on the CME (Chicago Mercantile Exchange).

Inside of this world of weather futures, investors are now able to trade Snow Futures and Options as reported in the Chicago Tribune and Bloomberg News:

Chicago Merc to trade snow futures, options

By Darrell Hassler and Nandini Sukumar
Bloomberg News
Published February 9, 2006, 2:19 PM CST


The Chicago Mercantile Exchange, the biggest U.S. futures market, is creating futures and options contracts that pay out based on amount of snow that falls in New York's Central Park and Boston's Logan International Airport.

The Merc, the only exchange to offer weather derivatives, is expanding its range as trading surges in existing contracts linked to the number of frosty days and the temperature in U.S., European and Asian cities.

Weather derivatives trading at the Merc jumped more than sevenfold last year to 889,000 contracts on demand from companies whose fortunes change with the weather. The derivatives might be used by municipal snow removers or energy traders, said Brian O'Hearne, managing director of the environmental and commodity markets for Swiss Reinsurance Co.

``There really is an increasing interdependence of commodity price action and weather action,'' O'Hearne said in an interview from his New York office. He is also president of the Washington- based Weather Risk Management Association, a trade group.

The derivatives will be based on a new snowfall index that the Merc will create, with contracts for each month from October through April, the Merc said in a memo to clients yesterday. Merc spokesman Allan Schoenberg confirmed the contents of the memo today.

The index will be based on the amount of snowfall in the designated month of the contract, as reported by Earth Satellite Corp. taking measurements at the Boston airport and New York park.

Futures are agreements to purchase contracts at a set date and time, while options give one side of the contract the right to do so. The contracts are settled only on the last day of each contract month, the Merc's memo said.

Schoenberg declined to elaborate more on the contract.

The Merc's shares fell $3.39 to $400.51 at 2:48 p.m. in New York Stock Exchange composite trading. Before today, they gained 92 percent in the past year.

-Piranha

Friday, February 10, 2006

Sound Money Management Key in Trading

Below is an excellent article on a topic I have been covering and teaching for years. At the end of the article, the author mentions Tharp’s book Trade Your Way to Financial Freedom and I recommend the book to anyone that is interested in position sizing and expectancy. I have developed a portion of my position sizing formula from this book. I don’t buy into everything in the book but there are a few very important chapters.


Sound Money Management Key in Trading

BY LOREN FLECKENSTEIN
INVESTOR'S BUSINESS DAILY

This story was originally published February 19, 1999

For more information, please see www.investors.com


A few years ago, forty people with doctorate degrees took part in a revealing experiment in money management.

Ralph Vince, an expert on the mathematics of trading, asked each participant to play 100 rounds of a computerized betting game. Each player started with $ 1,000 in play money and the freedom to vary the size of each wager. The odds favored players 60% of time.

At the end of the experiment, 38 of Vince's 40 highly educated guinea pigs had lost money. That performance illustrates a key to successful trading. Sound money management is just as important as being right on any given trade.

In the Vince experiment, the players won 60% of the games, but they still lost money. Why? They knew nothing about proper position sizing. So they made outsized bets that overexposed their bankrolls. They also fell prey to gambler's fallacy, an instinctive but deadly tendency to raise bets during losing streaks and lower bets during winning streaks.

People go broke making the same mistakes in the securities markets. With sound money management, you can avoid these pitfalls. And you can build considerable wealth while facing far worse trading odds than the 60% player advantage in Vince's computer game.

Most traders are wrong more than 50% of the time. And that's fine, said Vic Sperandeo, a Dallas-based options trader. Successful traders can be right on 35% of their trades and make killings. The name of the game is to cut your losses short and let your profits run.

A basic performance ratio proves the point. Let's say a trader loses money on 65% of his trades. But he follows an ironclad stop-loss rule. He sells any stock that falls 8% below his cost.

Meanwhile, he picks winners only 35% of the time. But he holds those stocks long enough to offset his losses and then some. On average, he sells his winners for a 32% gain.

Thanks to that discipline of cutting losses short and letting profits run, the trader makes twice as much money as he loses, even though most of his stock picks end in small losses.

Money management is even more critical in options and futures trading. Derivatives impose far greater price volatility than equities. So options and futures traders have short trading lives without strong money management. They also face unique time constraints.

Because futures contracts expire, futures traders know they must exit even a good trade at some point, said Cynthia Kase, president of Kase & Co., an Albuquerque, N.M.-based adviser on hedging and trading strategies. Equity traders don't have to exit a trade. They tend to be much more focused on getting into a trade than how to get out at a profit.

For many retail stock traders, loss cutting is perhaps the best-known part of money management. Many growth- stock investors use an 8% stop-loss rule. They sell if a stock falls 8% below its purchase price.

But money management can begin before you buy a security. It starts with position sizing. That means limiting the size of what you are prepared to lose in any single trade to a percentage of your total trading capital.

Why? There is always the risk that a position will tank before you can execute your stop-loss rule. For example, a stock can gap down at the open because of negative overnight news.

Such an event is more likely than you might suspect. Say the odds are only 1 in 100, or 1%. The more you trade, the more likely that event will occur. The probability of that event occurring over the course of 50 trades is 50%.

Sperandeo says that most successful traders rarely risk more than 2% of capital in a single trade. Many pros set the bar as low as 1%.

Take a 100,000 trading account. If the account holder sets the maximum loss per trade at 1% of total capital, he would cover any losing position before the account drawdown exceeds $ 1,000.

What if you also use price-based sell rules? No problem. With a little arithmetic, you can calculate a position size that satisfies both your sell rule and your maximum drawdown.

Let's say the above-mentioned trader wants to sell any stock that falls 8% below his purchase price? The maximum size of his position would be $ 12,500.

Kase uses position size to control portfolio risk. This allows her to adjust her stop-loss to reflect the market risk or volatility unique to each traded security.

The risk in the market is not what we want it to be, Kase said. The risk is what the market imposes upon us.

When Kase looks at trading a stock, option or commodity, she sets her trade's stop-loss just outside her calculation of that security's noise, random price movement produced by the security's typical volatility. The largest dollar amount that Kase will risk per trade is decided by her risk of ruin formula. More mathematically inclined investors may find it useful. For a full treatment, see Kase's book, Trading with the Odds.

Position sizing has another valuable benefit. It improves on gains during winning streaks. It curtails losses during losing streaks. During winning streaks, your capital grows, which slowly leads to larger position sizes. During losing streaks, position size shrinks with your account, leading to smaller losses.

Many people lose a bundle doing the exact opposite. They take bigger positions after losing trades and incur bigger losses. When they win, they shrink the size of their trades, crimping their gains.

Such behavior stems from gambler's fallacy, according to Van Tharp, a research psychologist who has studied the trading systems and habits of thousands of traders. He defines gambler's fallacy as the belief that a loss is due after a string of winners and/or that a gain is due after a string of losers.

Emotions and instincts drive much human behavior, but can lead to disastrous financial decisions. Tharp devotes part of his new book, Trade Your Way To Financial Freedom (McGraw- Hill 1998), to natural biases and behaviors that can harm trading performance.

Thursday, February 09, 2006

General Market Analysis

Due to our typical mid week special screen, I have uploaded another mini-screen with general market analysis and a few stocks that made noise on Wednesday (a few MSW Index stocks are included).

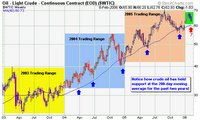
Oil prices fell again ($62.55) but still remain at historical highs. To put today’s prices into perspective, we must look at a multi-year chart to see how inflated the price of crude truly is. In 2003, crude was slightly above $30 a barrel and maintained its price throughout the year to close in the same vicinity in 2004. In early 2005, prices closed slightly above $40 en route to $70 over the next twelve months. Crude has dropped over $6 since the peak in late January which was close to the record highs set in late August. Supplies are up in the United States but many investors and analysts (yes the talking heads) still fear the tensions in Iran and the supply fears out of Nigeria.

So what does all of this mean?

It means that the market and investors are unsure of themselves and their investments with many questions unanswered. Looking at the New High-New Low ratio (NH-NL), we can see the dramatic drop in support of the leading stocks over the past week. The number of new highs for the first three days of this week has dropped 48%, 63% and 66% from the ratio of the first three days of last week. Even though we started last week with ratios of 572, 545 and 571, we ended the week in a decline, closing at 218-55. So far this week, we failed to surpass 200 new highs, two of the three trading days, not a sign of strength. Adding to this analysis is the fact that several stocks have been removed from the MSW Index based on sell rules and the fact that the Index dropped 4.65% earlier in the week.

The NASDAQ did manage to close back above the 50-d m.a. with a 1% gain and did close in the upper half of the day’s trading range (the first positive sign of the week). Cisco Systems posted earnings that topped analyst expectations, lifting the big cap stocks higher. As Investor’s Business Daily noted, recent leaders (AAPL), (HANS) & (GOOG) have fallen along with many of the leading energy stocks over the past few weeks. I know many of you have been locking in gains or cutting losses during this tumultuous environment and I commend you for following the rules. By following the rules, you will save yourself money on all fronts.

A few stocks that made some noise from yesterday:


  • STMP – 30.99, a stock we have been following on the daily screen for months. The recent slide to the 50-d m.a. turned out to be an excellent buying opportunity for trend traders.
  • EXBD – 102.25, another stock completed the $60-$100 move. The pattern was text book at it hit the $60’s and then corrected for several months before making the true run. The advance took about a year as patient investors were rewarded.
  • MLR – 24.50, after the correction from $22, the stock based and is now moving to new highs. The correction lasted for four months and should have shaken out most of the weak holders
  • TS – 156.44, up over $8 on volume 125% larger than the 50-d m.a. (the stock is now forming a high handle to the cup shaped base that lasted for four months)
  • OXPS – 30.97, up on volume 227% larger than the 50-d m.a. as the stock has setup another double top breakout above $32
  • HAL – 74.55, after reaching a 52-week high above $80, the stock has now corrected due to the drop in crude oil. The stock is energy related and has large ties to the Middle East which is at unease with the tension in Iran

Piranha

Tuesday, February 07, 2006

Determine a Stock’s Price target

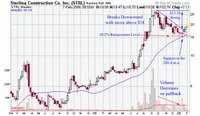
On Saturday, I added Sterling Construction Company (STRL) to the MSW Index as a non-traditional play. Why is it non-traditional for MSW? Because it was not breaking into new high territory as we screened it onto the Index. I said:

“This is not a typical MSW Index play but I see up-side potential on the chart after the correction in the $20 range and the support at the moving average. The down-trend was also broken as I will show you on the MSW Index charts. Rating: Buy (target is $30 in 2006)”

After giving a target price, I was questioned by a member as to how I came up with $30. I don’t teach how to develop price targets because there are many methods and none of them are extremely accurate and some vary greatly with their predictions. I don’t want to give false hope with a price target and I definitely don’t want to get sued by a member that believes a stock is going to reach a certain point based on my analysis. I run an equity research and education site, not an analyst firm so I am more concerned with finding stocks with the potential to move higher based on fundamental and technical analysis and not price targets (or upgrades and downgrades).

The stock entered the MSW Index at $18.93 on 2/4/06 with support at the 200-d m.a. I will show you two methods I use to develop price targets and then tell you why I picked $30 as a possible target based on the information provided by the two methods.

The first method to determine if the stock had bottomed is the use of the Fibonacci retracement levels (in this case, the 38.2% retracement which equals $15.46). It turns out that this retracement level also corresponds with the 200-d m.a. support and lifted the stock higher. Turning to the retracement level on the positive side, the method predicts a top at three common locations:
61.8%: $23.26
50.0%: $21.13
38.2%: $20.13

I also use another method that I first learned about in Stan Weinstein’s book “Secrets for Profiting in Bull and Bear Markets” called the swing method. This method takes the peak number ($28.35) and subtracts the bottom number ($15.05) to give us a swing number of $13.30. This was the size of the correction of the swing from $28.35 to the bottom at $15.05. Weinstein states that you take the swing number ($13.30) and add it to the peak number ($28.35) to give you a price target of $41.65. You can read more about this in chapter 6 of the book.

I now have two price targets that are completely different:
Fibonacci 61.8% retracement of $23.26
Weinstein swing method of $41.65

My target of $30 was developed by looking at the pattern and determining that the stock will most likely top near $30 if the former 52-week high is surpassed. The Weinstein method is accurate with CANSLIM type stocks and the Fibonacci method is very accurate when determining a pullback area.

Bottom line: everything is just a guess based on a certain set of parameters and information. No one truly knows where it will go. Place the position, set a sell stop slightly below the moving average and see what happens. If the stock gains more than 25% in the first few weeks, place a trailing stop to protect profits. Follow the rules and you will make money on winning trades and lose small amounts on losing trades. In the end, it should work out in your favor if you place several trades throughout the year. Several winning trades and several losing trades but the winners should be larger than the losers, keeping your portfolio in the black!

Piranha

Friday, February 03, 2006

Interesting Stocks with 15% of a New High

Today’s mini-screen was developed due to the two day exercise I performed on the typical daily screens on the main site. Instead of screening for stocks making new highs, I have decided to focus on stocks that are within 15% of a new high that possess strong fundamental and technical characteristics. I will review some of these stocks for the upcoming MSW Index this Saturday but we will not know if any of them are strong enough to make that list until tomorrow. Many of the stocks listed below are building bases are have started to form new trends that are suggesting higher prices in the coming weeks and/or months. Remember, the strongest stocks will land a spot on the MSW Index so don’t buy blindly because I post up a “mid week special screen” or a “mini-screen” on the blog. You still need to do your homework and determine if a specific stock will fit nicely into your portfolio and style of trading. I have eliminated all MSW Index stocks from the list below since I will cover them in depth tomorrow.

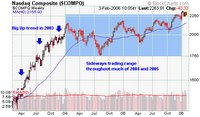
The DOW and the NASDAQ are flirting with their respective 50-d moving averages as they are still trading sideways when viewing a multi-year chart. The NASDAQ has been slowly creeping higher within the sideways pattern but has not launched a significant up-trend since 2003. We know the individual stock market leaders took a breather yesterday and the MSW Index stocks dropped more than the major indices but many of them did so on below average volume (a good sign). Friday will be important as some of our stocks will test support levels and/or moving averages. Today’s trading results may eliminate a few stocks from the Index, opening up positions for new candidates.

Interesting Stocks within 15% of a New High:


  • CEPH – 76.00, extended on the weekly chart but about to challenge the $77 high set on the point and figure chart

  • BBBB – 29.66, strong support this week with an 11.92% gap-up gain to recover the 50-d m.a. The support at the 200-d m.a. was very encouraging.

  • CLX – 63.08, forming a 10 month cup shaped base on the weekly chart that should form a handle before you look to take establish a position. If it breaks out, the stock will also qualify for the $60-$100 run

  • ANF – 69.27, forming an irregular cup shaped base that is currently forming the right side with higher lows on the P&F chart (support at the moving averages)

  • GRMN – 64.42, flirting with the 50-d m.a. as the stock sits in the $60 range but is not a an official $60-$100 candidate until it can breakout above the recent peaks set at $70.07 and $68.88

  • LRW – 25.54, set up for a triple top breakout with a move above $27. Solid support from the 200-d m.a. this week with a strong 8.27% advance on Thursday

  • CENT – 51.29, forming a six month cup shaped base with an obvious pivot reversal at the bottom of the cup in November

  • CNTF – 16.90, an interesting IPO from last fall that is starting to move higher with support from the 50-d m.a. On the weekly chart, a 10 week base has formed.

  • CERN – 48.35, an eleven week flat base has formed (it can also be considered a consolidation period after the larger up-trend in 2005. A triple top breakout will occur above $50

  • COGO – 9.11, a risky low priced stock that can make a double top breakout on the P&F chart with a move above $9.50 (risky play with an ideal entry closer to the 50-d moving average)

  • MCO – 63.95, when the stock reached the $40’s, it traded sideways for 7 months. It may do the same in the $60’s so if you make am options play for the $60-$100 run – give it time (at least 9 to 12 months).

  • PMCS – 9.76, not a typical stock selection for any MSW screen due to the larger overhead resistance that dates back many years but it did break the recent down-trend and has recovered the 200-d m.a. In my opinion, the risk is present but the chart suggests the stock is going higher.

Piranha

Wednesday, February 01, 2006

Let the Base Breakout before Buying

RightNow Technologies Inc. (RNOW) was removed from the MSW Index yesterday before it ever had a chance to make a move out of the cup with handle base it was forming. Earnings were up for Q4 but future expectations were lower than analysts expected, making this stock fall more than 20% in the first two days of trading this week. Any stock that falls 10% or more from the original coverage price is automatically removed to protect from further losses – no questions asked.

We have a rule on our Philosophy and Education page on our main site that states:

“We do not buy until the stock triggers the pivot point on above average volume also known as qualifying volume. This is the area where the stock faces the least amount of resistance as all overhead sellers are gone as we break into new high territory. The pivot point usually comes within 5% to 15% of the stock’s old high. Try not to buy a stock after it is 5% above the proper pivot point. This does not mean that we can’t buy on normal corrections and pullbacks as the stock remains in an uptrend. The rule only applies to the pivot point area as the stock becomes extended.”

RightNow (RNOW) didn’t breakout from the cup with handle base so you should have never bought the stock. Our analysis from week to week is listed below. To see a beautiful “successful” cup with handle breakout, study the chart located on our Technical Analysis page for Domino’s Pizza.

On our Technical Analysis page, we define a cup with handle pattern as follows:

"Look for relatively quiet volume as the stock builds the left side of the cup. Volume at the base of the cup should be slightly higher than the left side as support is coming into the stock. The right side of the base should have above average volume with more up-days than down days. The handle will be the last part of the formation and should slope slightly downward with lower volume than the right side of the base. Our pivot point will be slightly higher than the highest point of the right side of the base. All breakouts should occur on volume 100% greater than average daily volume."

RightNow Technologies (RNOW) fell 14.99% yesterday (bringing the weekly drop to 20.30%). You should all know that any stock that violates a 10% loss (RNOW - 10% sell stop was set at $17.34) on the MSW Index is instantly removed from the index. Volume was up 1,095% versus the 50-d m.a. giving us the largest distribution day in the stock’s short life on Wall Street.

I will repeat a story that I posted on the daily screen last night from a member (for emphasis): The member e-mailed me about this stock (RNOW) since he had already established a position at an earlier date. He asked about the up-coming earnings release Monday and what he should do. I told him to follow his gut feeling or sell half of his position if he was worried and not sure (remember, the buy signal had not come since the pivot point was not reached on MSW).

He asked about short term capital gains taxes and I told him that the “gain” in the stock was more important. I am not sure what he did as he has not written since the earnings release. If he followed his gut, I would have to say he sold before the 15% drop today. I could tell in his words that he was worried. When you are worried about a position, get out (you can ALWAYS GET BACK IN).

RNOW history on MSW Index:

January 7, 2006
Coverage Initiated at $19.27 with support located at the 50-d m.a.
Comments: Has made past daily screens as the stock started to form the right side of a long 14 month base since the original IPO run-up. The buy zone is slightly below $21 and it dates back to late 2004. The target here is a run to $35 in the next 9 months.

January 21, 2006
Posted at $18.65
The handle continues to form with a breakout above $21. Support is located below at the 50-d m.a. ($18.13) Rating: Buy on strong move above $21


January 28, 2006
Support $18.13
Buy Zone: $21.00
A 7.24% gain this week as the stock is setup to breakout above the $21.00 buy point on the P&F chart. A triple top breakout will occur above $21. Volume should reach approximately 2 million shares on the breakout. Rating: Buy on strong move above $21

The stock never made the breakout so NO ONE should have bought the stock prematurely or you would be breaking rules. If you broke rules – you lost money in this trade. IT IS THAT SIMPLE!!! FOLLOW THE RULES!!!

Piranha