Market Talk with Piranha is currently moving to its new home at chrisperruna.com. The new site is up and running but many of the posts need editing as the images and stock charts did not transfer successfully (thanks blogger). I will post all new entries to both blogs – Thank you for your patience while I make this change!

Thursday, August 31, 2006

Current Market Temperature

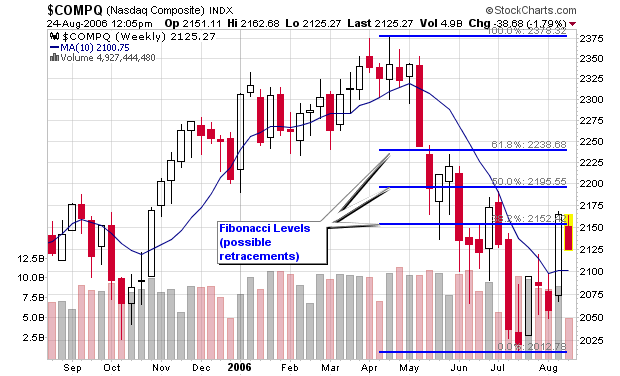
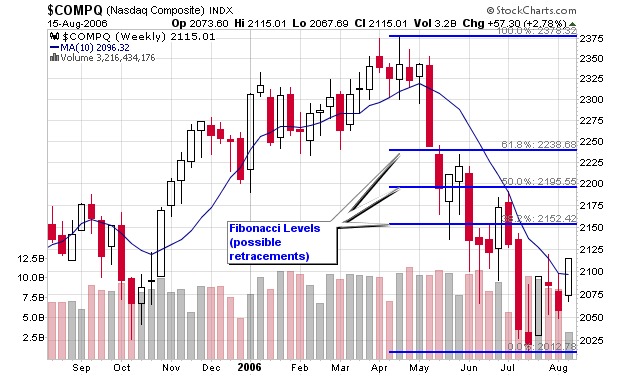
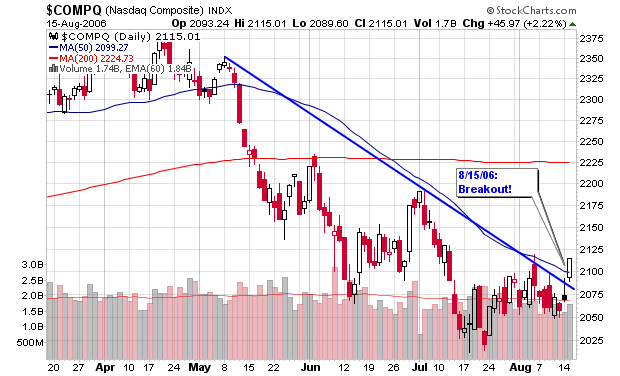
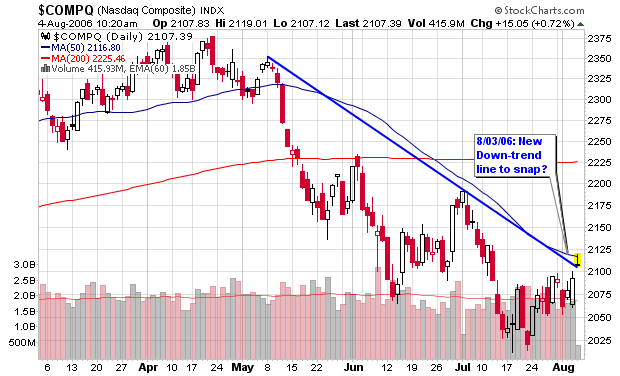
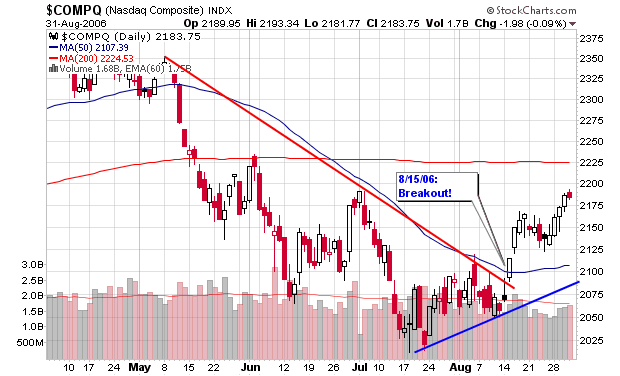
The NASDAQ is following the Fibonacci plan of action to a ‘T’! It retraced to the 38.2% level and then consolidated for a week as I noted and is now hitting resistance near the 50% retracement level. It wasn’t really a question of if but when the NASDAQ would reach to the 50% retracement level. The index faces a decision once again: to consolidate one more time before attempting to move to the next retracement level or pull back and gain some support near the 50-d moving average. I still suspect a pull-back to the 50-d m.a. as the index still needs to fill a gap-down in that area (see the NASDAQ daily chart provided). I will not guess what the index will do and will only trade the signals.


Looking at the daily chart of the NASDAQ, we can see that the index is now trending higher and has been since it started to retrace. Volume has been weak but that can be attributed to end of summer conditions. Volume should start to pour back into the market as September carries on and institutional investors return from vacation.


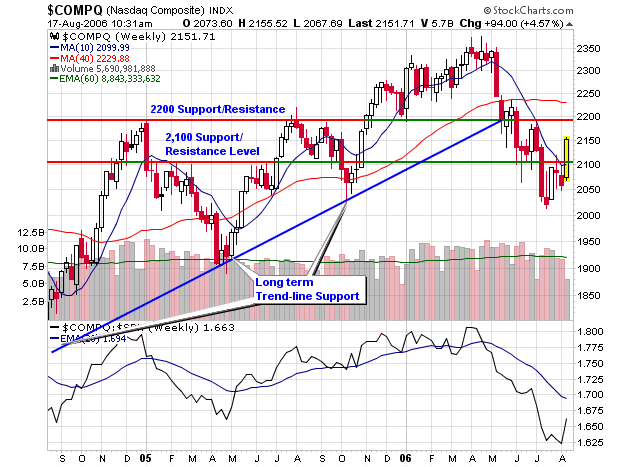
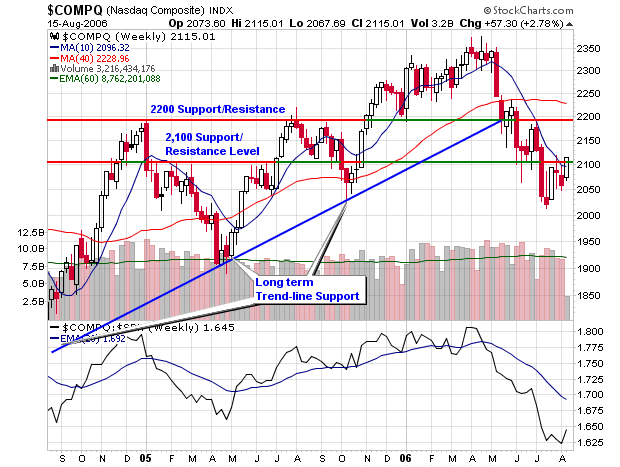
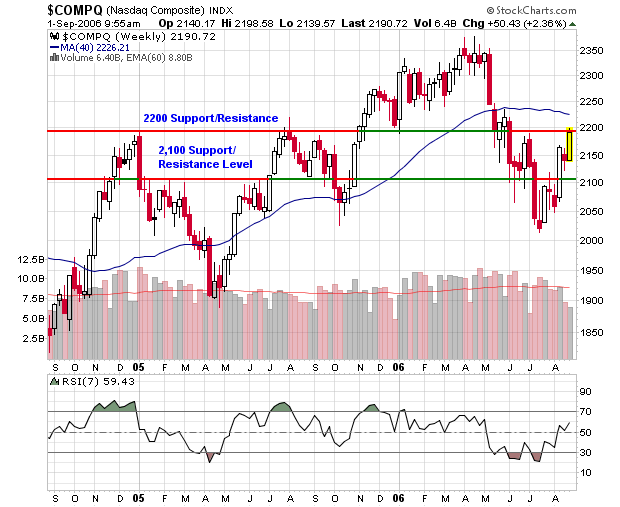
A closer look at the weekly chart will show you that the NASDAQ is now testing long term resistance just below the 2,200 level (very similar to the Fibonacci retracement level of 50%). Again, volume is weak so I am not sure if the index will have the power to overtake this area but I will watch to see if a trading range forms between 2,100 and 2,200. Look back exactly one year to see what I am taking about.


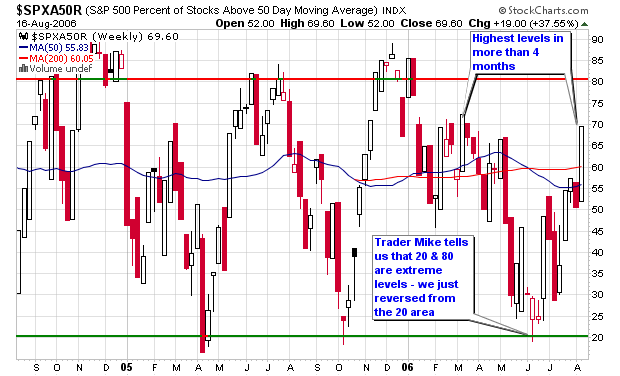
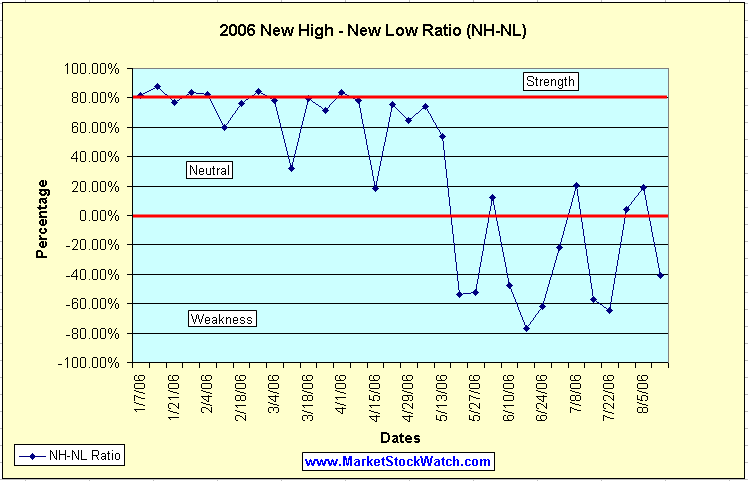
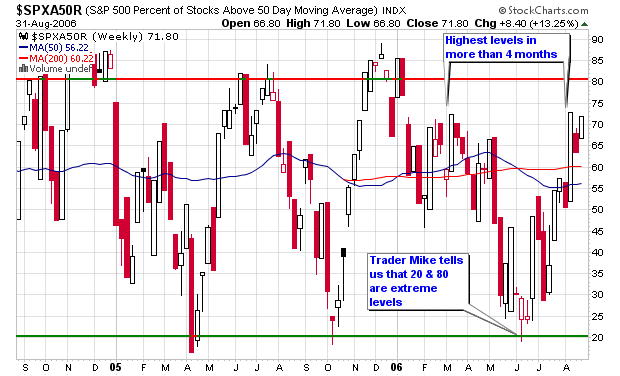
The percentage of stocks making new highs on the S&P 500 is still near four month highs so I am not concerned about any weakening of the potential individual leaders. The NH-NL ratio has been positive for the most part but not overwhelming with strength. As long as it stays positive, we don’t have too much worry about.


The Gold chart is similar to the NASDAQ retracements as I wanted to point out how the commodity is using the Fibonacci levels as support and resistance. Currently, the commodity is using the 38.2% retracement level as support as it trades in a sideways range between $600 and $650 with larger support below near the 200-d m.a. Notice how Gold reached the third retracement level and then sold off to consolidate into its current range. The move could be considered textbook to some.


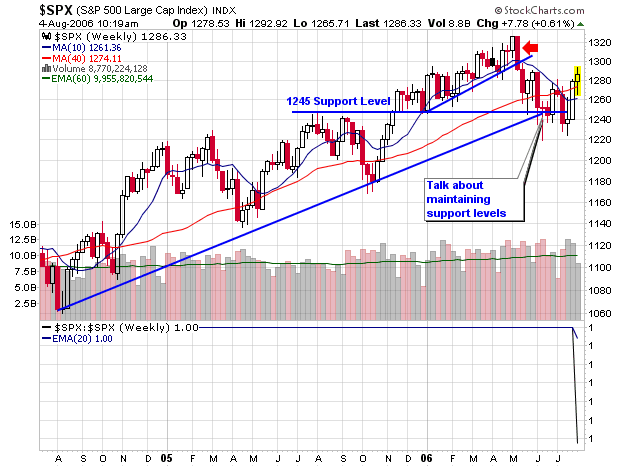
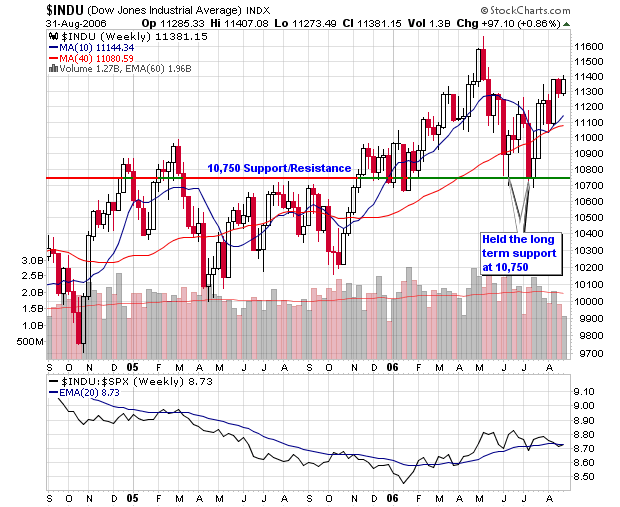
Both the DOW and S&P 500 are forming cup shaped patterns with support below at their respective moving averages. I am interested to see what will happen as they approach all-time highs (if they can in the next couple of months). When they approach these highs, study the RSI chart to see if the buying is coming in with strength. As a follower of CANSLIM, I would love to see both indexes form a cup with handle pattern and then break-out with powerful volume along with individual leaders. That type of action could start a rally.


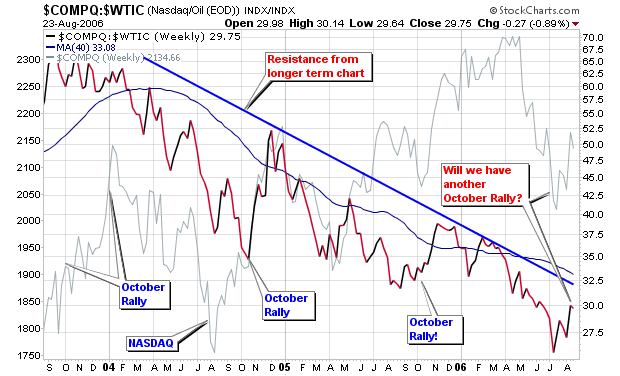
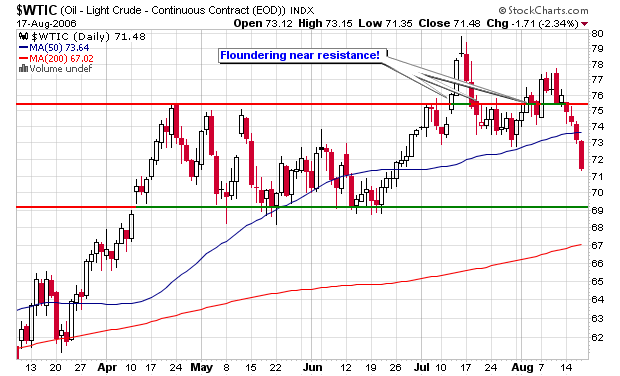
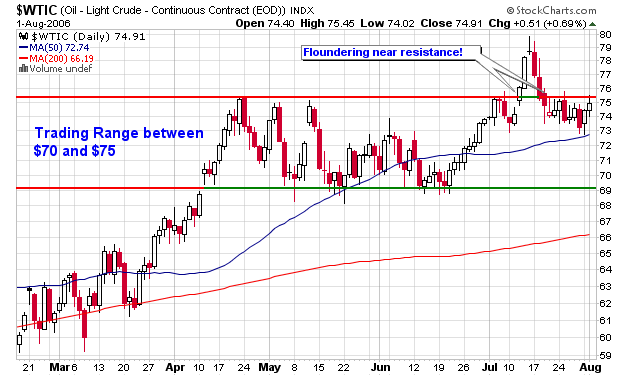
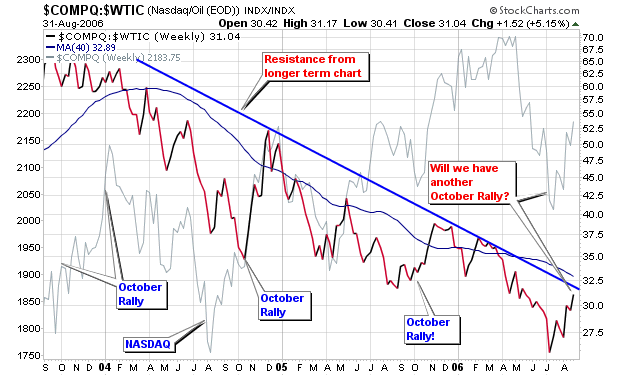
Finally, I will focus on the crude oil contracts as we can see that they are testing support near $70 with more support at the 200-d m.a. (slightly higher than $68). I would not become concerned with crude oil until it sold below the 200-d m.a. on heavy volume which could and most likely would propel stocks in the opposite direction. The combination index I have uploaded shows the relationship between crude oil and the NASDAQ and the current short term trend is higher while the longer term trend is still lower.


Enjoy and click on each chart for a larger view!
Piranha

Labels:

Possible Short Setups

I will start by saying that I am not a professional "day" trader but I am looking to move in that direction and will start to test out my skills with basic technical analysis setups. I figured I would start with the first setup explained in John Carter’s book, Mastering the Trade; see my post from Monday.

I am posting up four charts of stocks making new 52-week highs but have made these highs on lighter volume and with a weaker RSI. The RSI is actually making lower highs as the stock moves to higher highs which creates a bearish divergence.

Comment on my charts and give me your thoughts. I will disclose that I have already established a position in at least one stock and may establish another position today. The name of the stock is not important as I am just testing some strategies.

Click the charts to enlarge them!


Enjoy,
Piranha

Monday, August 28, 2006

Mastering the Trade, quotes by John F. Carter

The quotes below are provided by John F. Carter, master day trader; pulled directly from his new book Mastering the Trade.

This may be the best quote of all:
“The financial markets are naturally set up to take advantage of and prey upon human nature. As a result, markets initiate major intraday and swing moves with as few traders participating as possible. A trader who does not understand how this works is destined to lose money”

“The financial markets are truly the most democratic places on earth. It doesn’t matter if a trader is male or female, white or black, American or Iraqi, Republican or Democrat. It’s all based on skill.”

“A trader, once in a position, can deceive himself or herself into believing anything that helps reinforce the notion that he or she is right”

“…professional traders understand this all too well, and they set up their trade parameters to take advantage of these situations, specifically preying on the traders who haven’t figured out why they lose”

“…markets don’t move because they want to. They move because they have to.”

“After all, the money doesn’t just disappear. It simply flows into another account – an account that utilizes setups that specifically take advantage of human nature.”

“As soon as Wall Street announces a special vehicle for trading a particular market or strategy, then that market or strategy is done for.”

“Remember, the markets are set up to naturally take advantage of and prey upon human nature, moving sharply only when enough people get trapped on the wrong side of a trade.”


“In casinos, as in trading, it takes only one stupid bet to blow the whole wad”

“Casino owners know this, and this is why they sell the strategy books right there on the property, prominently displayed in their own gift shops”

“This is the biggest poker game on the planet, and the money flowing into your account isn’t appearing as if by magic. It’s coming from someone who is still learning how the markets work, and who most likely followed his or her gut and got suckered into taking the wrong side of the trade.”

“The problem is that tactics an individual uses to achieve his or her goals in everyday life do not work in trading, and in fact are one of the main reasons for failure.”

“The determination, positive thinking, and stubbornness that made people a success in one area of their life simply sets them up for slaughter in the markets”

“The markets thrive on taking the rules and ideals that govern general society, wadding them up into a ball, lighting them on fire, and then shoving them down a new trader’s throat.”

And Finally

“The only people who understand traders are other traders”

The book is full of excellent quotes such as these but it goes even deeper into how to trade like a professional and why the markets prey upon human nature. It was an excellent read and I will be going through it several more times to pick up everything I missed on the first go-around!

Piranha

Thursday, August 24, 2006

Using Fibonacci Retracements

I was asked this question in my recent comments after posting a NASDAQ chart with Fibonacci retracement levels:

“How do you find the fibonacci levels of a stock? Is it part of your screening tools or?

I ask as i've never tried to implement fibonacci analysis in my swing/day trades, however of late since i've been following your blog, you seem to talk quite a bit about it”


I answered the question with a quick link to a Fibonacci calculator I use and then realized that I don’t have a blog entry for understanding Fibonacci numbers. So instead of rewriting what has already been done, I have decided to point you all to a great blog entry titled How to Use Fibonacci Retracements To Trade Stocks by Craig over at the Swing Trading Guide or better know as the Taz Trader Blog

I use Fibonacci retracements for longer term outlooks for major indexes but sometimes use them for individual stocks that may be catching solid support along the 200-d moving average. The most important thing to know is that it is only a secondary indicator in my arsenal, not a front line tool.

If you look at the attached NASDAQ chart, you can see how the index has stalled near the first retracement level as I indicated last week prior to the advance. I suggested a brief consolidation before the NASDAQ looks to move towards the 50% retracement level near 2,195.

By the way, Stockcharts.com has a built-in Fibonacci tool that allows me to draw the levels within seconds. A great tool for their annotated charts!

Piranha

Wednesday, August 23, 2006

Will the NASDAQ be 50% higher in 6-12 months?

I posted up a chart looking at the relationship between the NASDAQ and crude oil contracts a couple months back in an entry titled “Can the NASDAQ – Crude Oil Index predict Bulls & Bears”.


The combo index highlighted the relationship of the two indexes and actually told us on a higher level when and where the market was making rallies or starting major down trends over the past 10 years. Visit the link above for a further description of the actual combo index.

As this year moves on, I have noticed that the combo index continues to reach new multi-year lows while traveling below its 200-d moving average. Recently, it started to move north but still lives beneath the moving average and long term trend-line or resistance. I am still wondering if this index is useful and if it can confirm a sustainable rally if it crosses back above the 200-d m.a. and multi-year resistance line.

While reviewing the three year chart, I noticed the spikes in October and was wondering if it will do the same this year since the action is starting to resemble previous years (post bubble burst era). Whatever the case, it will be very interesting to see many indicators move to the positive side simultaneously all confirming a possible rally towards the end of this year. The Stock Trader’s almanac states that mid-term election year lows usually peak 50% higher in the following 6-12 months. We are now in a mid-term election year and several indicators look to be hitting bottoms with an urge to move higher.

So I ask:
Will the NASDAQ be 50% higher in six to twelve month from this year’s bottom?

Only time will tell and I will not know the answer until my most important indicators give me the green light signal to buy heavy on the long side!


Piranha

Labels:

Tuesday, August 22, 2006

NewMarket Corp. (NEU)

NewMarket Corp was up almost 9% on Monday at $62.98 on volume 260% larger than the 50-day average as it closed at a new 52-week high for the first time since May. I started to screen NEU in July on the daily screens and added it to the MSW Index on July 29, 2006 at $48.84. I have pasted my analysis below from the past several weeks while on the MSW index. As you can see, my ideal entry was a move above $53 where the stock filled the previous gap-down from early May. The setup was perfect and the breakout was text-book on heavier volume.


As I just noted, the breakout came earlier this month on heavier volume as featured on the daily and weekly screens. I don’t want to scare holders out of the stock but please remember that EZPW was up over 26% in a few short weeks and has now fallen back to even on the MSW Index. I warned to take profits in that stock and warned to never let a profit dip below 20% once it has surpassed 25% (especially in 2006). Place your hard stops in NEU so you can realize the gain if it starts to form a handle or consolidation. I wanted a new handle to form before looking for the next entry area at the new pivot disclosed this past weekend at $60.43. The stock triggered this new pivot point but did so without the handle I was looking for so I did not add new shares. I am actually looking to take profits and protect myself from any pull-back.

I still like the chances for a possible $60-$100 run later in the year (after October) but I am wary about the action in September (a historically weak month). Looking at the institutional holdings, I can see that 113 money managers (13F), 136 mutual funds and three other holders currently own shares in the company. During the latest reporting period; 45 money markets, 32 new mutual funds and 2 banks placed new positions while only 13 institutional investors sold out. This all sounds great but the number of shares sold was basically even with the number of shares bought even though new positions eclipsed sold-out positions. The top holder during the latest reporting period was Dimensional Fund Advisors with 698,190 shares, a 13F institution (money market).

Earnings per share have grown from $1.92 in 2004 to $2.45 in 2005 with slowing projections this year and next.


Analysis from MSW Index:
7/29/06

NEU- 48.84, The stock is holding the support area noted on the watch list from two weeks ago. The buy would be a move above $53 which serves as the gap-down area. Just as stocks pull back to fill gap-ups, they breakout to fill previous gap-downs. This is the #4 rated stock on the IBD 100 Index. Rating: Buy above $53

8/05/06:
NEU – 53.07, The stock broke above the gap-down buy area of $53 on Thursday buy dropped on Friday to close at the level. If $53 is held early next week, this will be the ideal short term entry area (right now). The decline on Friday came on volume less than Thursday's advance but it was slightly above the 50-day average. Rating: Buy above $53

8/7/06: (daily screen)
NEU – 57.50, the buy was a move above $53 as indicated on recent daily and weekly screens. The stock was up more than 8% today on volume 133% larger than the 50-d m.a. NewMarket was originally screened at $48.84 on July 29, 2006 for a current MSW gain of 18% (a total of 6 trading days)

8/12/06:
NEU – 56.40, The stock made the breakout from last week but did reverse near $60 on Wednesday. The strongest stock on the index at this time as it could become stronger with a move to new highs. I made a test buy last week but I didn't buy many shares. I will sell with a move below or near $50, otherwise, I will hold. I will look to add shares on a move to new highs. Rating: Buy was above $53, more shares can be purchased on a move to new highs

8/19/06:
NEU – 57.94, The stock has completed the four month cup shaped pattern and should develop a handle over the next couple of weeks. I encourage a handle to form for several weeks before the next advance into the possible $60-$100 run. Rating: I am a buyer if a nice downward sloping handle forms (the pivot point is now $60.43)

Piranha

Saturday, August 19, 2006

Excellent Quotes of Time

THINK IT
"What the mind of man can Conceive and Believe, it can Achieve." - Napoleon Hill

"You become what you think about all day long" - Ralph Waldo Emerson

“You are today where your thoughts have brought you, you will be tomorrow where your thoughts take you.” - James Allen

“Do not think of knocking out another person’s brains because he differs in opinion from you. It would be as rational to knock yourself on the head because you differ from yourself 10 years ago.” - Horace Mann, educator - How many traders feel this way?

BELIEVE IT
“You can have anything you want. There are no limits to your possibilities.” - unknown

“Whether you believe you can do a thing or not, you are right.” – Henry Ford

“One of the greatest discoveries a man makes, one of his great surprises, is to find he can do what he was afraid he couldn’t do.” – Henry Ford

"We must walk consciously only part way toward our goal and then leap in the dark to our success." — Henry David Thoreau

SEE IT
"If one advances confidentially in the direction of his dreams, and endeavors to live the life he has imagined, he will meet with a success unexpected in common hours." – Henry David Thoreau

“Your biggest competitor is your own view of your future.” - Jim Taylor

“A person is limited only to his or her reality of what is possible financially. Nothing changes until that person’s reality changes. And a person’s financial reality will not change until he or she is willing to go beyond the fears and doubts of her own self-imposed limits.” – Robert T. Kiyosaki

WORK IT
"Time is more valuable than money. You can get more money, but you cannot get more time." – Jim Rohn

"Time is our most valuable asset, yet we tend to waste it, kill it, and spend it rather than invest it." -Jim Rohn

“You can’t build a reputation on what you’re going to do” – Henry Ford

"Everything comes to him who hustles while he waits." – Thomas Edison

"I buy when other people are selling.” – J. Paul Getty

“There was no such thing as half-trying. Whether it was running a race or catching a football, competing in school - we were to try. And we were to try harder than anyone else. We might not be the best, and none of us were, but we were to make the effort to be the best.” - Senator Robert F. Kennedy, in a tribute to his father, Joseph P. Kennedy

“We are what we repeatedly do. Excellence, then, is not an act, but a habit.” – Aristotle

"Do not confuse motion and progress. A rocking horse keeps moving but does not make any progress." Alfred A. Montapert, American Author

"Don't measure yourself by what you've accomplished, but rather by what you should have accomplished with your abilities." - John Wooden

“An Entrepreneur's income generation is different than someone that worked at a job. Income generation for a person working was LINEAR. Entrepreneur income generation is EXPONENTIAL. Basically, very, very slow to begin, then as time progresses, explosive.” - Michael John

DON’T STOP
“When one door closes, another door opens: but we so often look so long and so regretfully upon the closed door that we do not see the ones which open for us” - Alexander Graham Bell

"A window of opportunity won't open itself.” - Dave Weinbaum

“Destiny is not a matter of chance, it is a matter of choice; it is not a thing to be waited for, it is a thing to be achieved. - William Jennings Bryan

"The quality of a person's life is in direct proportion to their commitment to excellence, regardless of their chosen field of endeavor." -Vince Lombardi

“I wasn’t going to be one of those people who died wondering, what if? I would keep putting my dreams to the test – even though it meant living with uncertainty and fear of failure. This is the shadow land of hope, and anyone with a dream must learn to live there.” - Alex Haley, writer

STAY THE COURSE
"There are no secrets to success. It is the result of preparation, hard work, learning from failure.” - General Colin Powell

“Many of life’s failures are people who did not realize how close they were to success when they gave up.” – Thomas Edison

“People are always blaming their circumstances for what they are. I don't believe in circumstances. The people who get on in this world are the people who get up and look for the circumstances they want, and, if they can't find them, make them.” - George Bernard Shaw

"Every worthwhile accomplishment, big or little, has its stages of drudgery and triumph; a beginning, a struggle and a victory." - Ghandi

LOVE IT
"The average person puts only 25 percent of his energy and ability into his work. The world takes off its hat to those who put in more than 50 percent of their capacity, and stands on its head for those few and far between souls who devote 100 percent." — Andrew Carnegie

"You have to find something that you love enough to be able to take risks, jump over the hurdles and break through the brick walls that are always going to be placed in front of you. If you don't have that kind of feeling for what it is you're doing, you'll stop at the first giant hurdle." – George Lucas"

"If all you're receiving for your work is money you're being grossly underpaid." -Alan Cohen

GIVE IT
"If money is your hope for independence you will never have it. The only real security that a man will have in this world is a reserve of knowledge, experience, and ability." — Henry Ford

"The man who will use his skill and constructive imagination to see how much he can give for a dollar, instead of how little he can give for a dollar, is bound to succeed." — Henry Ford”

“Time and money spent in helping men do more for themselves is far better than mere giving.” - Henry Ford

"What you put out is what you get back and the reason so many are so short of money is that they put little or nothing out." --Stuart Wilde

“The mediocre teacher tells. The good teacher explains. The superior teacher demonstrates. The great teacher inspires.” - William Ward, Texas Wesleyan University administrator

LIVE THE LIFE YOU’VE IMAGINED

CONCEIVE IT
BELIEVE IT
ACHIEVE IT

“You can have anything you want -- if you want it badly enough. You can be anything you want to be, do anything you set out to accomplish if you hold to that desire with singleness of purpose.” - Abraham Lincoln

"He who wishes to be rich in a day will be hanged in a year" Leonardo da Vinci

"I hear and I forget. I see and I remember. I do and I understand" Confucius

"As you make your rise to the top, never forget about the important things, especially you most important “true love”." – Christopher Perruna

-Put together by Chris Perruna "Piranha"

Friday, August 18, 2006

Ten Stocks under $10

I’ve had several requests to do a special screen that locates interesting stocks under $10. As you know, I am not a big fan of stocks trading below $10 but I will perform a screen with this criteria about three or four times per year (to feed the craving).

Humans and their psychological minds love to dream about picking that one big winner from a low place and then ride it to riches. It does happen but not very often so don’t build your trading system from this type of thinking.

The last big winner on MSW from the sub $10 area was Forward Industries (FORD) in 2005 but this stock has since turned into a short in 2006. FORD etched the classic chart pattern that Stan Weinstein talked about in his excellent book Secrets For Profiting in Bull and Bear Markets (stage 1, stage 2, stage 3 and stage 4 bases). Actually, I think I will save this chart and add it to my technical analysis page on MSW as the “textbook” example of a four stage Stan Weinstein pattern.

Now, let’s have some fun and screen some stocks below $10 that present potential opportunities for those of you that can stomach buying these candidates. The stocks below do have decent relative strength ratings and earnings per share ratings.


Interesting Stocks under $10 – A screen for Fun:
*All prices from the close on 8/17/06

  • NXG – 3.86, catching support near the 50-d m.a. as it trades in a range between $3 and $4 over the past 14 weeks.
  • SLW – 9.45, the young stock is catching support at its new 200-d m.a. as it starts to build momentum to test all-time highs above $12. A move above $12 shows strength.
  • JSDA - 7.80, risky as it tests its 200-d m.a. The sister stock of HANS may have downward pressure if Hansen Natural continues to stumble below its 200-d m.a. Stocks move in packs so be wary if HANS breaks down further
  • Q - 8.59, nice strength with confirming volume over the past couple of weeks as the stock continues to tread higher. It has a long history of higher prices so it could be a longer term winner.
  • STKL - 8.53, the stock advanced more than 100% earlier in the year and is now correcting but the interesting thing I notice on the chart is the decrease in volume while consolidating the former gains. Support at the 200-d m.a. may provide a nice opportunity but wait for the move (don’t enter early)
  • GNA - 9.58, a trading range has developed between $8 and $11 but the most recent high in July could not surpass the prior high from April which is typically negative. A move above $11 would grab my attention.
  • NSSC - 9.65, seems to be catching support at the 200-d m.a. with a trading range between $8 and $12. It must move above $12 to prove the potential advance.
  • DTLK - 9.13, the stock is EXTENDED at current prices but it can become a buy opportunity if it falls back towards the 200-d m.a. and catches support. I wouldn’t consider a position until it at least pulls back to the 50-d m.a. just above $7 and fills the gap from last month.
  • GIGM - 8.58, building a 14-week base with support near $7 and resistance at $11. A double top breakout will confirm on the point and figure chart above $10.50 and a new high above $11.
  • CUP – 4.22, low priced risky stock that is looking to catch some support near $4 and the area above the 200-d m.a. With stocks gaining strength, commodity related stocks are declining but if Gold regained its footing, Peru Copper could continue the advance from its 2005 IPO. The original pivot point breakout in May was above $4.05 so look for the stock to hold this area.

I wanted to screen one last stock for pure fun: MSW
MSW – 10.79, Mission West Properties is above $10 but only slightly. I don’t know much about this company but it is gaining some strength near the 200-d m.a. as it consolidated from the prior run earlier in the year. The stock has not trended much over the past several years but I thought it would be fun to check the chart.

I have also included a chart of the NASDAQ which shows the breather that I indicated in yesterday’s blog entry. The index is pulling back today (expiration day) while some investors ell at this first Fibonacci retracement level. I also included a chart of the crude oil contracts as they are crashing down through the 50-d moving average. Major support is still owner near $69-$70. It will be interesting to see crude challenge this area; territory it hasn’t seen in two months.


Piranha

Thursday, August 17, 2006

NASDAQ creating Trading Opportunities

The NASDAQ has reached level one (38.2%) of the Fibonacci retracements with a 4.57% advance this week. The index may take a breather since we have made gains the past three days with a gap-up yesterday. However, if the strength in the market is true, the 50% retracement level should be the next target for the NASDAQ after a slight breather.


The 50% retracement level (2,195) is where I can see the index hitting stronger resistance since several factors come into play. The first is the actual Fibonacci retracement itself, the former breakdown from late May to early June and the longer term resistance and support line near 2,200 which dates back to the start of 2005.

If resistance is met, a short term short play may be in store for the NASDAQ; take a look at the QQQQ for a possible option play. You could also play the SPY as it is moving in stride with the NASDAQ this week.


Finally, the percentage of stocks above the 50-d m.a. on the S&P 500 have reached their highest levels in more than four months as indicated on the chart below. This market move is showing strength as several secondary indicators are confirming such as the stocks above their 50-d m.a., the NH-NL ratio and the action among individual stocks.

Keep in mind that September is the poorest performing month in recent history so a reversal is not out of the question. Protect your positions and don’t get emotional with this recent burst of strength. It can turn on a dime and you must be ready to act. Remember, the NASDAQ is still trading below its 200-day moving average (a negative in my book for a sustainable rally).


Piranha

Labels:

Wednesday, August 16, 2006

NASDAQ looking for Retracements

Several things happened with the NASDAQ during the trading day on Tuesday:

The NASDAQ clearly broke above the down-trend line noted on the chart I have featured several times on this blog while also recovering the 50-d m.a. and the 2,100 resistance level. I spoke at length this past weekend on my weekly analysis over at MSW about these resistance levels and I made an in-depth argument as to why the NASDAQ can reach the retracement levels or re-visit lows set back near 1,900.


Volume was higher on Tuesday than Monday’s action but still light compared to the average since we are in the middle of August (summer volume is always weak).

The new highs topped new lows on Tuesday as most of the positive news could be attributed to the inflation report (the first positive day in more than a week).

Here is some of my commentary from the MSW weekly analysis from this past Sunday:
From 8/13/06:
“Now, if the NASDAQ were to breakout above all three of these levels (speaking about the down-trend line, the 50-d m.a. and the 2,100 resistance level) and individual stocks confirmed, it would be a major short term buy signal, one that I am watching very closely. On the downside; if the NASDAQ were to make a weekly close below the previous low near 2,020, we could be visiting areas between 1,900 and 2,000.

Where do I see this?

Take a look at the weekly of the NASDAQ and the next level of support near 1,900, set back in April 2005. September is the weakest month of trading for the market over the past decade so I would not be surprised to see this level revisited with a close below 2,000. But…

Using 1,900 as the low level of the most recent advance of 2,350 as the peak, we have retracement levels of 2,178, 2,125 and 2,071. With the NASDAQ closing at 2,057 this week and an intra-week low of 2,012 a few weeks back we might expect a rally as a temporary bottom may be developing since all three retracement levels have been met and then some. The Fibonacci retracements suggest that the market is over-sold and could have a short term bounce.

Using 2,378 at the high value and 2,012 as the low value on the daily chart, we can now see that a possible positive retracement can take place to any these three levels:
38.2%: 2,151
50%: 2,195
61.8%: 2,238

Based on recent NASDAQ action, I could see the index reaching the 50% retracement since the most recent peak was set at 2,190 at the end of June and early July (this peak materialized at the 50-d m.a. and the down-trend line found using the daily chart).

I hope I haven’t confused you yet! To recap, I have talked about a possible drop to 1,900 and a possible retracement rally between 2,151 and 2,238. I can’t tell you which one is more likely to happen but that is not my job. My job is to point out possible scenarios and give you an adequate chance to capitalize on the move and be prepared for the possible move. Now that you know what type of moves can happen, you can get yourself ready for possible trades that will allow you to make a profit in either direction (only if you are comfortable trading in both directions). This is how traders make money; they assess the situation and then look for possible trades that can benefit in either direction and they do all of this during their off hours (not during the trading day). Since the work will be done prior to the move, your setups and triggers will be set prior to the action so you will be able to make an unemotional decision in the “heat-of-the-action”.”

MSW members were privy to this market analysis prior to Tuesday’s move!
With yesterday’s move, we will now see if the first retracement level will be hit and then the possibility of a run to the 50% retracement level (see the attached chart).

Piranha

Labels:

Monday, August 14, 2006

New Highs and New lows telling a Story

A few months back I asked if the New High – New Low Ratio (NH-NL ratio) was reliable. Take a look at the chart and the numbers and tell me what you think.

The chart in this blog entry was calculated using the simple math explained in an entry I wrote earlier in the year, which can be found here: Is the NH-NL ratio Reliable?


To calculate the percentage correctly, use this formula:
(New Highs – New Lows) / (New Highs + New Lows) * 100 = X%

The one thing I would like to stress is the huge drop from borderline "strength ratios" in April to negative weakness in May (just the time the market started to tell us all to get out and head for the sidelines and lock in gains).

Brett Steenbarger talks briefly about his findings while studying the new highs and new lows in the market. Take a moment to visit his “Market Context” for August 14, 2006 to see what he has to say.

I will conclude by saying that the NH-NL ratio is extremely reliable (lagging but reliable)!

Below is an updated look at the weekly averages for the NH-NL Ratio:
Saturday, January 14, 2006: 500-32
Saturday, January 21, 2006: 348-46
Saturday, January 28, 2006: 516-46
Saturday, February 4, 2006: 449-44
Saturday, February 11, 2006: 229-57
Saturday, February 18, 2006: 306-42
Saturday, February 25, 2006: 420-36
Saturday, March 04, 2006: 399-49
Saturday, March 11, 2006: 162-84
Saturday, March 18, 2006: 459-53
Saturday, March 25, 2006: 312-52
Saturday, April 01, 2006: 441-39
Saturday, April 08, 2006: 481-58
Saturday, April 15, 2006: 150-103
Saturday, April 22, 2006: 540-75
Saturday, April 29, 2006: 353-76
Saturday, May 6, 2006: 503-74
Saturday, May 13, 2006: 384-116
Saturday, May 20, 2006: 64-211
Saturday, May 27, 2006: 57-182
Saturday, June 3, 2006: 119-93
Saturday, June 10, 2006: 72-204
Saturday, June 17, 2006: 41-310
Saturday, June 24, 2006: 56-238
Saturday, July 01, 2006: 127-198
Saturday, July 08, 2006: 143-95
Saturday, July 15, 2006: 74-273
Saturday, July 22, 2006: 66 - 307
Saturday, July 29, 2006: 163-151
Saturday, August 5, 2006: 194-132
Saturday, August 12, 2006: 88-210 - This Past Week

New highs vs. new lows from last week (we were negative all week):
Monday showed a ratio of 83-147
Tuesday showed a ratio of 114-187
Wednesday showed a ratio of 126-235
Thursday showed a ratio of 62-281
Friday showed a ratio of 53-198

Piranha

Friday, August 11, 2006

Thinking instead of Acting

I was reading another post on a forum and came across another interesting topic. The guy making the post responded to my piece on the TICKS and said this:

"One big problem with technical analysis and the use of indicators is that it confuses causes and effects. The move of the NASDAQ is the cause, the movement of the indicator is the effect. The NASDAQ doesn't fall because the indicator says so. The indicator says so because the NASDAQ has fallen (please note the past tense). Nature works in a very predictable way: you cannot manage the effect (investing based on the indicators) without first managing the cause (figuring out why the NASDAQ moves in a certain way)."

Here is how I answered this person:
You are correct that technical analysis is the effect but I am not trying to get in at the bottom or out at the top. I catch the trend and technical analysis will always give you the underlying trend and that is where my money is made.

Using the indicators (lagging or not), I always know the trend and will place my trades with that trend. I am not always right but I use several position sizing strategies to hold my risk to a minimum which allows me to capitalize on my winning trades and cut the losers quickly.

By trading with the trends, I could care less what the “true” cause is for the movement (that is a waste of time). All I need to know is the direction the market is moving in. Nature may be predictable but the market is not so knowing the cause is useless because causes are always priced into a market in advance. I buy the trend and look for the cause in the news in the following days, weeks or even months. In my opinion, causes are old news by the time they become known!

Too many times, I see people think too deeply into the market and always miss the move because they need to know the reason why the market is moving. I don’t care why it is moving, I only care to know if and when it is moving so I can get in or out of my positions. As I said above, I will look for the “cause” or reason when it hits the headlines in the future!

Piranha

Wednesday, August 09, 2006

Discovering the TICKS

I was reading through Trader Mike’s blog Wednesday night and came across a very interesting indicator that can be studied on a chart. In his post, Review of “Mastering the Trade” by John Carter, I was reminded about an indicator I have seen on several occasions but have never taken the time to research because I am not a day trader (yet).

Before going further; have you ever been in a situation where you see or hear something once but pay no attention, see it a second time and possibly take a deeper look but then see it a third time and really jump into the concept. I first heard about the indicator TICK or $TICK on stockcharts.com when reading through SFO magazine. I don’t remember the author’s name but I will assume it was John Carter and will take a look later this morning as I save every edition of SFO. The second time I saw TICK was during my 4th of July vacation while reading Martin Schwartz’s Pit Bull as he explained how the indicator is a must for his system. Schwartz said exactly what John Carter’s article states about the levels of TICK so I must assume that many great traders use this indicator. Wednesday was the third time I came across this indicator and the second time in one month so it must be something that my subconscious wants me to look into further (yes, I believe in the subconscious and the idea that the proper tools are presented to a student when they are ready for them). I hope that doesn’t scare anyone away but read Napoleon Hill or watch The Secret and you will understand where I am coming from.

What is a TICK?
The TICKS ($TICK for NYSE or $TICKQ for NASDAQ) summarize the number of stocks on the NYSE that are increasing in price versus those that are decreasing in price from the previous price quote.

Anyway, after reading the blog post and then re-reading John Carter’s article, I started to play with the chart and overlay market information. What was really interesting was the $TICKQ which represents the NASDAQ and how it predicted the top in the market today. While doing my research tonight, I realized that the NASDAQ peaked just before noon (approximately 11:45am) and then headed down for the day. This happened at the exact same time that the $TICKQ reached an intraday high above +800 and then reversed during the 5-minute candlestick. The actual candlestick closed below +600 for the timeframe and then quickly dropped by 50% over the next five minutes which should have told day traders that the market was turning down with heavy selling pressure.

Looking at the chart posted in the blog entry, you can see how the purple line (representing the price of the NASDAQ) topped at the peak of the $TICKQ and then went south for the remainder of the afternoon. The indicator attempted to cross above +500 a few times during the afternoon but was quickly turned sideways or in the opposite direction, confirming the weakness and selling pressure. By 2:30, the indicator was staring to violate -600 and the NASDAQ was reaching intraday lows as most stocks were starting to turn from green to red on my computer screen.


I admit that I don’t know much about this indicator and only started to research it today but I can already see its power and understand how it may help me with my current and future trading systems. I understand charts and this chart was amazingly accurate today so it has caught my interest. I was already interested when great traders such as Martin Schwartz consider it a must and then it is confirmed by John Carter in SFO and then one of my favorite stock bloggers in Trader Mike. I read about indicators and oscillators every day but I toss most of them aside because they have no value to me at this time with my current trading style but I knew within minutes of studying my charts today that this indicator will be added to my arsenal. As I continue to study the indicator and eventually use it with my trading, I will report back on this blog if it has helped or hindered or has done nothing at all.

Piranha

Tuesday, August 08, 2006

Simple Thinkers

Have you ever been on a message board, forum or in a discussion where a person tells you that earning ‘X’% per month would make you the richest person alive in ‘X’ number of years. For instance, I recently read a post by a forum writer that said:

“If you ever find such an investment you should immediately reinvest all got.

Month 2 you would have $20K producing $20K a month.

By the end of your first year you'll have over 20 millions bucks and at the end of year two you will be by far the richest man alive.”

The question posed earlier in the thread said:
“Are there any ways that could earn $10K per month consistently”

To some people, $10,000 per month is peanuts but to others, it is a large sum of money; something so inconceivable that they bark about all the reasons why making this type of money is impossible. To be honest, it's only $120k per year; not that impressive in New Jersey anymore!

What struck me the most about this post was the fact that the responder was using such elementary thinking when answering the question. By using proper money management techniques, an investor would never risk their entire stake on one investment because it was returning a specified amount or percentage each month. If I am trading with a positive expectancy system that is averaging a return of $10,000 per month, why would I double, triple or quadruple my risk just so I could make more money. Non-investors are always thinking about the up-side potential and never worrying about the downside. Maybe the person earning $10,000 per month has formulated a system with positive expectancies and a quality position sizing technique that allows them to make this sum without risking too much of their original capital.

If the investor were to double the size of their bet or increase it even further, they run the risk of ruin on one bad transaction; therefore, becoming the richest “person” in the world in not an option by doubling-down the size of the specific bet or business strategy. It sounds to me that the person responding to this post is a roulette player that believes that doubling each bet after a loss will allow them to break even which couldn’t be further from the truth.

Be aware of the “talkers” on the web and don’t buy into everything they say because much of the crap I come across is that: “crap”! Just because someone has an investment strategy that pulls in $10,000 per month does not mean it is as simple to double up on the original investment in order to bring in $20,000 per month and then repeat the process to bring in $40,000 per month (eventually making you the richest person alive in a few years). I highly doubt the responder in this post has ever studied probabilities, risk, reward, expectancy or any other mathematical logic before giving his two cents. I will also assume that he is the type of investor (or gambler) that always has a hot tip and will bet the farm on that tip because he sees the potential of profit on the other side of the fence rather than the possible loss (risk of ruin) by risking too much.

Try out this logic: Ask 10 friends or family members which situation they would choose if given the opportunity:


  1. Risk 90% of their net worth for a 5% chance of multiplying it 50 fold
    or
  2. Risk 1% of their net worth for a 70% chance of doubling it.

What would you choose? And Why?

I think many of you know which number I would select based on my past blog entries and my investing style.

Steer clear of internet TALKING HEADS & SIMPLE THINKERS!

If you are interested in reading high quality material on the web, take the time to visit my blogroll and links section on each sidebar. No talking heads here!
Piranha

Image provided by: http://www.scholarnet.co.nz/flo/savings_item1.php

Friday, August 04, 2006

Interesting Stocks to Watch

The NASDAQ is trading near the 50-day moving average today and has actually pushed above the down-trend line placed on my chart. If the index can follow through and close above both the moving average and the trend line, I consider this a successful week. I voted neutral on the latest Ticker Sense Blogger Sentiment Poll after voting negative the past couple of weeks (I hate to be on the fence but I am). If the NASDAQ can trade above these areas and the NH-NL ratio can continue to stay positive, I will start to get more of a positive feel for the overall health of the market.

The S&P 500 is forming a cup shaped pattern and has overtaken the 50-d and 200-d moving averages and has moved higher in above average volume the past three weeks. Earlier this week, we had our strongest daily NH-NL ratio in months which tells me that some institutional buying is taking place as the summer heads down the home stretch. In any event, don’t rush to buy stocks on the long side until we get a market breakout and a strong weekly confirmation with the NH-NL ratio. Another important aspect to the market possibly gaining strength will be the health among the individual market leaders. Until they can gain their footing and move higher with volume support, we can continue to be skeptics (protecting our capital).

Below are a few stocks that interest me at this time along with a couple of lists highlighting the action from Thursday’s market (similar to a typical daily screen I run each night).

Some Interesting Stocks to Watch:


  • CELG – 46.95, a move above $50 is a buy signal on the P&F chart as the stock has a strong long term trend above the 200-d m.a. (since February 2005)
  • GILD – 62.07, buying above the moving averages as the stocks qualifies for a possible $60-$100 run
  • BOT – 127.06, a stock I profiled earlier in the year on this blog that actually corrected but is now challenging all-time highs. I am slightly skeptical of the long term move but the trend has been higher for the past couple of months (especially since it recovered the 50-d m.a. near $105 in June
  • EZPW – 38.82, could this be the handle formation to the 15-week cup shaped pattern? A move to new highs is very positive especially if volume increased above average
  • CMI – 119.28, up and down as buyers and seller struggle to take control of the direction of this stock. Buyers have a slight advantage at this point in time
  • TWGP – 29.37, trading in a consolidation range between $26 and $32. A buy happens above $32 with a triple top breakout on the P&F chart
  • AB – 66.04, the MSW Index stock continues to make the 200-d m.a. play successful as it also qualifies for a possible $60-$100 run


A Few Interesting Stocks making New Highs Thursday (8/3/06):


  • OMX – 44.42, first double top breakout yesterday above $44, another will qualify above $45 as a spread point and figure breakout
  • GES – 48.41, a 14% breakout above $47 this week with Thursday’s gain coming on volume 282% larger than the 50-d m.a. (50-day moving average)
  • CTSH – 70.31, a solid 10% move this week to breakout above $70 on above average volume (RSI line at all-time high)
  • EME – 54.26, the 200-d moving average play has now gained 22% over the past two weeks. Do not chase at this point but keep an eye open for a future consolidation


A Few Interesting Stocks within 15% of a New High (Thursday’s Market – 8/3/06):


  • ANSS - 50.39, a strong rebound with support at the 200-d m.a. Volume was up over 219% yesterday, signifying institutional buying power
  • NEU - 53.97, an MSW Index stock forming a nice basing pattern with a possible $60-$100 run in the future.
  • GIL - 47.32, another 200-d m.a. play with solid support from institutions as volume was up more than 280% on Thursday
  • PSA - 83.40, a 21-week cup shaped pattern with heavier buying over the past week or so. I prefer to see a handle form before takeoff so be careful with any entries in this area.
  • PVA - 71.28, the daily chart is somewhat sloppy but the weekly chart shows support at the 200-d m.a., a support line it has held over the past couple of years
  • TRMB - 49.05, reaching a new 52-week high in the early morning hours of trading on Friday (slightly extended from the major moving averages but it is gaining momentum)
  • PZZA - 33.95, I don’t like their pizza but the stock is gaining support at the 200-d m.a. in the midst of an eight month consolidation. Breakout to new highs is an entry signal (above $36 on the P&F chart)

Piranha

Wednesday, August 02, 2006

Tropical Storm “Chris” affecting Market

Crude oil topped $76 earlier today as Tropical storm CHRIS (what a name) gathers strength in the Caribbean and heads towards the Gulf of Mexico and possibly the Gulf Coast. Investors fear that the storm could grow into a hurricane and possibly disrupt oil output from the rigs in the Gulf area (similar to Katrina and Rita from last year).

As an article by Simon Webb stated: “Last year's hurricanes shut a quarter of U.S. crude and fuel output and sent oil to record highs. Around 12 percent of the U.S. Gulf of Mexico's 1.5 million barrels per day (bpd) oil output is still offline.”

As you can see on the chart, crude oil has been trading in a range over the past couple of months with a support line near $70 and a shorter term support/resistance line near $75.

With the crisis in the Middle East and the threatening storm, oil related stocks and futures will be hot short term plays!


Piranha