Market Talk with Piranha is currently moving to its new home at chrisperruna.com. The new site is up and running but many of the posts need editing as the images and stock charts did not transfer successfully (thanks blogger). I will post all new entries to both blogs – Thank you for your patience while I make this change!

Monday, January 30, 2006

MSW Stock Index on Fire

The MSW Index was busy today as 14 of the 27 stocks were up by 2% or more. For the day, the Index was up 1.33% but that includes the 5.95% drop in (HANS), a stock that I placed my sell at $95 and placed the MSW Index sell at $89.89 (our typical $60-$100 profit safety). Excluding the loss in (HANS), the index gained 1.62% (in addition to last week’s 4.65% gain. The fourteen stocks that moved ahead by 2% or more gained an average of 3.71% with True Religion (TRLG) leading the pack with a 7.52% gain.

The MSW energy stocks raced ahead with (GMXR) leading the pack with a 6.75% gain.
(UPL) was up 3.36%
(HYDL) was up 2.74%, did so on volume 151% larger than the 50-d m.a.
(HAL) was up 2.45%
(LUFK) was up 2.07%

The big winner from last week, Netlogic Microsystems (NETL), added another 2.48% on volume 139% larger than the 50-d m.a.

Finally, Under Armour (UARM) broke out above our buy zone of $40 with a 5.06% gain on volume only 19% larger than the 50-d m.a.

I will continue this analysis after I perform the typical “end of the day” research for tonight’s daily screen.

See you then,
Chris "Piranha"

Sunday, January 29, 2006

Additional Weekly Analysis

The New High – New Low (NH-NL) ratio finished at 826-33 on Friday, the largest single day total since July 11, 2005 when it closed at 826-17. We have been following the weekly NH-NL weekly averages since the week of July 16, 2005 and have not had a more successful week than the past five days. This week’s average of 516-46 slightly edges out the week of July 30, 2005 when the ratio closed at 511-28. This was only the fourth week in the past six months where the weekly average closed above 500 new highs.

Below is a list of the weekly averages since July 16, 2005:
Saturday, July, 16, 2005: 503-21
Saturday, July 23, 2005: 382-23
Saturday, July 30, 2005: 511-28
Saturday, August 6, 2005: 465-38
Saturday, August 13, 2005: 250-62
Saturday, August 20, 2005: 124-59
Saturday, August 27, 2005: 129-62
Saturday, September 3, 2005: 267-71
Saturday, September 10, 2005: 375-48
Saturday, September 17, 2005: 253-63
Saturday, September 24, 2005: 226-157
Saturday, October 1, 2005: 255-116
Saturday, October 8, 2005: 197-144
Saturday, October 15, 2005: 46-317
Saturday, October 22, 2005: 73-220
Saturday, October 28, 2005: 111-162
Saturday, November 5, 2005: 241-93
Saturday, November 12, 2005: 231-111
Saturday, November 19, 2005: 248-155
Saturday, December 02, 2005: 312-73
Saturday, December 10, 2005: 309-77
Saturday, December 16, 2005: 293-104
Saturday, January 7, 2006: 473-47
Saturday, January 14, 2006: 500-32
Saturday, January 21, 2006: 348-46
Saturday, January 28, 2006: 516-46

As you can see, we are starting to gain some strength in January with two of the past three weeks averaging 500 new highs or greater. January has been one of the strongest months over the past year and the leaders are starting to gain momentum. Backing up the strength of the ratio has been the performance of the MSW Index over the past several weeks. As mentioned yesterday on the weekly screen, the MSW Index gained 4.65% this week, topping all of the major market indices and the IBD 100. Netlogic (NETL) was the biggest mover with a 20.25% gain, bringing its total gain on MSW to 56% since it was posted on 11/11/05. As you know, I only added one new stock to the Index this week, bringing the total to 27 stocks but I am studying a few others.

Looking at the NASDAQ, which was up 2.5% for the week, we can see how the Index moved back above the 2,275 level (the short term support/resistance line). The index also crossed back above the 50-d moving average on the largest positive weekly volume in the past two years.


Both the DOW and the S&P 500 crossed back above their respective 50-d moving averages with the DOW recovering the 10,750 support/resistance line. The small cap S&P 600 hit a new all-time high with a 3.4% gain while the MidCap 400 also hit an all-time new high with a 2.2% weekly gain.


Continue to monitor the major indices (price and volume), the NH-NL ratio and the individual stock market leaders. Here are some of our MSW Index leaders over the past few months:
(GMXR) – 90%
(CTRN) – 70%
(HANS) – 62%
(NETL) – 56%
(CRDN) – 52%
(ESRX) – 51%
(NWRE) – 42%
(OXPS) – 33%

Piranha

Friday, January 27, 2006

ESRX in the Home Stretch

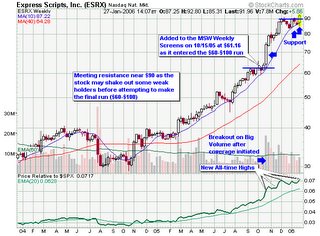
I started to cover Express Scripts (ESRX) in early October as it neared the $60-$100 range while forming a short term consolidation before attempting to make the big move. I officially added the stock to the MSW Index on 10/15/05 at $61.16 as it broke-out into this range. Below is what I said when I added the stock to our Index:

“Express Scripts, Inc. (ESRX) was added to the weekly screen as the stock will debut on the MSW watch list. It is above $60 and has a long history of strength so it is a prime candidate for the $60-$100 run. Some of you may think the stock is priced too high and has already run up too much for additional gains but I will counter by asking you to look at former MSW stocks that started coverage in the $60 range: HANS and BMHC. Also take a look at Tenaris (TS). The stock has been mentioned on a handful of daily screens and was named on our short list during last week’s final screen. The stock has entered the $60-$100 run and is currently sitting slightly above the 50-d m.a. which is a trend buying opportunity.” – 10/15/05

To date, (ESRX), (HANS) and (TS) all remain on the MSW Index with Tenaris (TS) making the biggest moves into new high territory in recent weeks.

I made these comments on the MSW Index about (ESRX) last Saturday:
“The stock failed to cross $90 two times this week. The resistance at this level continues to grow. A strong close above $90 is an instant buy. Rating: Buy with move above $90” – 1/21/06

Today, the stock is up over 3% and has finally broken above the resistance level at $90. With the move above $90, we are now in the final stretch of the $60-$100 run. The stock has gained a respectable 50% over the past three months on the MSW Index. I don’t know about you but I will always take a steady 50% gain in a $60 stock rather than roll the dice with a $5 stock that has no prior history of strength.

Now is the time to place the physical sell stop to protect the gains from the $60-$100 move. ESRX is just another example of a long line of stocks that easily trek from $60 to $90+ in a matter of months.

The image will enlarge to the proper size!


Piranha

Thursday, January 26, 2006

Mini-Daily Screen

Due to the special screen exercise I initiated to all members last night, I didn’t have a chance to upload a more traditional daily screen. Below is a condensed version of the typical daily screen from yesterday.

Four of the top ten performing industries on Wednesday came from the Metals/Steel sector. Half of the stocks located in the metal distributors industry made gains that resulted in new 52-week highs. A quick glace at IBD would show you that this industry group is ranked fourth out of 197 total groups with a 20.3% gain in 2006 (by far one of the early leaders in the new year.

On the flip side, six of the worst performing industry groups were oil and gas related as crude oil closed down $1.21 to $65.85. As I mentioned over the weekend, crude oil prices have not been climbing due to supply worries; they have been climbing due to growing concerns in Iran and Nigeria. Of the five energy related stocks on the MSW Index, (GMXR) and (LUFK) fared the best. Geo Resources (GMXR) is now up over 83% since it was added to the MSW Index on September 27, 2005 (it is up over 180% since the first daily screens it started to make last July). Lufkin is up almost 20% since making the MSW Index in mid-December.

The NASDAQ and DOW both moved lower on higher volume but the losses were minimal so the distribution doesn’t weigh as heavily on the recent count. The count now stands at five distribution days for the S&P 500 and NASDAQ over the past month of action. The DOW is still within 40 points of the long term support and resistance line that dates back to early 2004. The NH-NL ratio finished at 453-52 (a solid sign of strength among the leaders).

Some Interesting Stocks from Wednesday:

  • LUFK – 63.60, bucking the trend as the stock brings its total gain to 19% on MSW
  • GMXR – 43.92, a total gain of 83% in four months
  • VIVO – 25.97, a big intraday reversal that has spilled over into a 5% loss today. Support sits at $23 with our Index entry at $24.16
  • NMHC – 30.40, building a 19-month base with new 52-week highs and an ascending triple top breakout on the P&F charts.
  • LCAV – 52.38, another new high for this former MSW stock from late 2004 and early 2005
  • NETL – 33.03, up yesterday and up another 5% today as the stock continues to rise without taking a breather. Keep those physical stops set and allow them to trail the growing profits. With today’s gain, the stock is up 47% since the initial coverage on 11/12/05 at $23.56 (not bad for two months).
  • CRDN – 54.55, topping $56 on Thursday, bringing the MSW Index gain to 48% since the initial coverage on 10/28/05
  • KNOT – 14.44, as you know, we cut the stock from the MSW Index when it fell below the 50-d m.a. but it has since reversed, gathered strength and moved to new highs. It will not be back on the Index but I thought it deserved some notice.

Piranha

Wednesday, January 25, 2006

Low-Priced Stocks Rarely Provide Actual Bargains

...I wanted to share an article I read in IBD earlier today. I couldn't agree more with the author so I decided to post her words rather than re-write what she has written so perfectly. I have no problem buying stocks between $10 and $25 but as most of you know, my recent success has come from stocks priced above $60 and a few making a run from $20 to $40.

BY CHRISTINA WISE
INVESTOR'S BUSINESS DAILY
www.investors.com

People are drawn to bargains like moths to a flame.

It's the reason Kmart has Blue Light Specials and Wal-Mart (WMT) touts its price rollbacks.

But when it comes to investing, all too often you get what you pay for.

Though it might be tempting to snatch up 1,000 shares of a stock priced at just a few cents or a few dollars a share, these companies often aren't the market's best performers.

For one thing, there's usually a reason a stock is trading at rock-bottom prices. The company's profits could be disappointing or nonexistent; its product may not sell; or the firm itself may be tiny, with a minuscule market share.

Large investors such as mutual funds, pension funds and insurance companies tend to steer clear of cheap stocks since they can't buy large positions without sending the stock's price flying.

As a result, low-priced stocks are often thinly traded, which can make them more prone to wild price swings. Since you want to cut losses at no more than 7% to 8% from a buy point, a loss of a few cents could knock you out almost immediately.

Another risk in buying cheap stocks is that if the share price falls far enough, the stock could be delisted and bumped from the exchange. Or the company itself might go out of business, making your investment even more difficult to cash in.

Besides, at the end of the day, the return you make on your stock investment is based on the percentage gain or loss the stock makes — not on the number of shares you have.

A better strategy is to focus on stocks priced $10 a share or higher. Your investment candidates should also have solid earnings and sales track records. The stock market tends to reward strong fundamentals as signs of leadership.

Though a stock that's fallen well below its former highs may look like a bargain, remember: There's probably a good reason it's trading so low. Instead, focus on stocks that have already worked their way through a base and are poised to move to higher ground.

Tuesday, January 24, 2006

DOW testing Support / Resistance Line

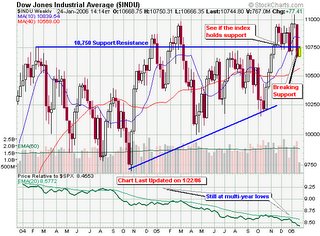
...The DOW broke below the 10,750 support line last week on the largest weekly volume (distribution volume) since October. It is making an attempt to recover the line today but is now using the level as resistance. Looking at the chart below, you can see how the 10,750 line has been used as support and resistance numerous times since early 2004. The price relative to the S&P 500 is still sitting at multi-year lows so don’t expect this index to lead the market any time soon and don’t place your analysis in the hands of a laggard index. Continue to monitor the NH-NL ratio which finished at 273-54 last night, well below the critical 500 new highs needed for a strong rally.

Looking at my monitor at 2:30pm:
The stocks in my portfolio are showing a profit.
The majority of the stocks on the MSW Index are in the black.

Today’s MSW % gain leaders (2:30pm):
(CTRN) – Citi Trends
(VIVO) – Meridian Bioscience
(CRDN) - Ceradyne


Image enlarges to "real size".
- Piranha

Buying Option Contracts

MSW Member Question:

Hi Chris,
congrats on your TS calls. I wanted to know about how many contracts do you usually buy for a given stock,and how deep in the money do you buy them? (or do you buy them OTM?)

It seems like: Find a growth stock (60-100 or not) Buy ATM or ITM Calls for 6 months to 1 year out (Leaps). Wait for a decent point move and sell out I've bought a bunch of different Calls for different stocks, I have some on OXPS I bought on the drop and have had some on UPL for a while, but I only have 2 contracts each, not out of lack of funds but feeling I had to be diversified.

This however does not produce big returns for me when the stock moves. Should I be buying more contracts?

thanks for your input.

My Answer:
Good to hear from you!

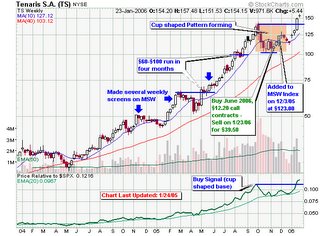
I only bought 3 call options with (TS) because it was a risky play buying at the bottom of a base formation. The rule of thumb is to only buy as many call options as you would buy shares in the company. So, at $110, three call options controlled $30,000 in shares or 300 x $110. However, I do know option traders that buy many more shares than they could ever handle and do okay for themselves. I like to buy near the money or slightly in the money options. Occasionally I will buy out of the money options but I have had better results with the ladder. Options expiring six months to one year out are not leap contracts. Typically LEAP contracts are two years out from the current date. I rarely buy LEAP contracts.

In the case of Tenaris (TS), I thought out in my mind where the stock could realistically travel. Due to the cup shaped formation, $145 seemed like a very logical position for the pattern to form a handle so I set that as my target. I told myself I would sell when it passes this point. In this case it did, so I sold even thought I still had almost five months left in the contract. A 223% profit in two months is hard to debate when it meets my original objectives. When you start to get greedy and break original objectives, you typically lose money. I have had that happen too many times so I sold with asking questions.

Buy as many contracts as you feel comfortable with. Don’t worry about the overall profits at this point. Worry about the percentage gain you are achieving with each position. When you consistently make large gains, increase the size of your positions.

I am still learning to trade options so I don’t teach my methods just yet. I stick to what I know best: buying stocks making new highs, grabbing shares near support or moving averages and stocks breaking out from strong patterns.

Piranha

Sunday, January 22, 2006

Coach (COH) & Tower Group (TWGP) Removed

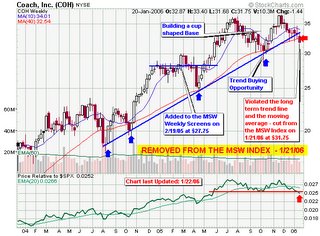
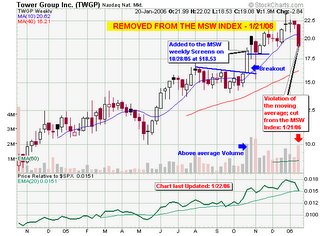
As you know, I removed both Coach (COH) and Tower Group (TWGP) from the MSW Index this weekend as they both violated moving average support lines. I will include the charts in this blog to highlight what I am seeing and why they were removed.

In the case of Coach, I have been a long time supporter of the stock with coverage going back to early last year but it is turning into a laggard compared to the other leaders. I said it was a sell with a break below $32 last week so I must follow rules and take the profits for the MSW Index and move on. The relative strength rating has dropped from:
89 on July 29, 2005 to
83 on November 30, 2005 to
75 on December 12, 2005 to
66 on January 4, 2006 to
48 on January 22, 2006 (today)

We had an excellent trend buying opportunity in October and touted this area on numerous occasions at the same time (URBN) was making a final push to new highs before breaking down. In my opinion, it is sometimes a better policy to cut a stock while it still shows a small profit rather than waiting for it to give you a small loss in the future. When things don’t look or feel right, sell. Remember, you can always get back in if the trend reverses.


In the case of Tower group, the stock opened up for a 20% gain on the Index, only to be cut at the knees for a 12.96% drop below the 50-d m.a. I started the coverage in late October at $18.53 but have an uncomfortable feeling with the recent drop. As mentioned, the stock maintained a 3% gain while on the Index but I feel safe taking the very small gain rather than a small loss if it continues to drop. Even though the stock doesn’t show a loss at this point, you must learn that taking a small profit before it materializes into a loss may be the best course of action. The next level of support is the 200-d m.a. (currently near $15.94). I am not waiting around to see if it holds my entry area or this lower level of support above $15. The current RS rating sits at 88 for (TWGP) but has dropped off from 96 earlier last week.


Piranha

Friday, January 20, 2006

Mid-day Market Report

Over the past month we have seen the NH-NL (new high – new low) ratio gather strength briefly, only to falter this week. The ratio ending on Saturday, January 14, 2005 gave us a weekly average of 500 new highs, the first time we topped this mark since last July. The month of October averaged 136 new highs per day, November averaged 240 new highs per day and December averaged 305 new highs per day (excluding the holiday shortened week). We saw the up-trend coming by watching this indicator and the price and volume of the major market indices. Following the leading stocks allowed us to place positions before the crowd started to realize a mini-bull run was underway.

Heading into today’s action, we are looking at a weekly new high average near 321 stocks per day. If Friday’s action stays in line with the current weekly average, we will drop to the lowest levels of 2006, stepping down more than 180 new highs per day from last week. I am not turning bearish because the ratio is far from turning negative, a situation we have not seen since the final week of October when the NH-NL ratio closed at 111-162. One of the worst weeks of last year came in mid October when the ratio ended at 46-317 on October 15, 2005 (a far cry from last week’s 500-32).

The market reversed the bear trend yesterday with a strong showing of leadership, giving us 471 new high with many of the MSW Index stocks making large gains. As a group, the 28 stocks moved up over 2%, regaining the entire 1.25% loss from the previous day. Yesterday is long gone though because today we are getting beat down with sharp losses across the board as GE and Citigroup break the DOW. As of 12:30pm Friday, twenty of the twenty eight MSW stocks are showing a loss with (AAPL) and (GMXR) leading the way (two of our best stocks over the past six months). I could care less about the leading DOW stocks as I focus intently on my personal holdings and the remainder of the MSW Index. When they are falling, I know the market is having a bad day or making a correction.

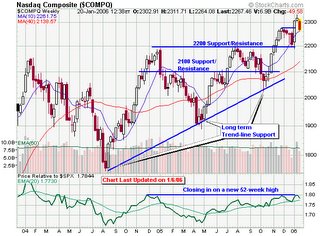
Looking at the NASDAQ chart below, you can see how the index is challenging the recent breakout level and the 50-d moving average. Looking at the price relative to the S&P 500, we can see that the NASDAQ has been struggling to break above the resistance line for the past three months. If the 50-d m.a. is sliced, I will be looking back down to the long term support at 2,200. Stay tuned to see how the markets close this afternoon and what the final NH-NL ratio will be later today.


Piranha

Thursday, January 19, 2006

Away during the Trading Day

MSW Member Question – Part #2:

Hello Chris,

I am new to MSW and also to investing in general. I had a question regarding breakout volume. Intra day, how is it possible to determine that there is above average volume? Let's say that early in the morning, the price is around 17.50 and the pivot/breakout point is 17.75, how is it possible to determine that there is above average volume for this particular stock so early in a trading day? I'm a bit confused. Also, I attend school for major parts of the trading day, is it even possible for someone like me to focus on breakouts if I can't be at the computer monitoring the stock and volume?

By the way, I'd like to say thanks for all your great screens. I have learned so much in just a few days.

Talk to you soon

My Answer:

To answer your second question: anyone can trade without monitoring their stocks during trading hours. I don’t day trade and I don’t need to watch a computer during trading hours as I make 99% of all my decisions after the markets close so I am less likely to make a poor emotional decision during the intraday action. If you continue to read my screens and my analysis each night, you will realize that I make many of my trading decisions over the weekend when I can’t be influenced by live action. Believe this or not but I almost always make better decisions during the weekend after I can digest larger amounts of information versus a decision during a weekday or week night when emotions are flying high. Again, this is just my own style as it differs for each person.

For example if I see a stock creeping up on a breakout area over the weekend, I will make a decision in my head to buy immediately if it passes the pivot point on strong volume the following week. I have triggers set up to alert me when this happens during the week so I can react without hesitation because my mind is already made up. I have thought-out the scenarios in my head before the breakout happened so I don’t have to think twice to make the buy – it’s already a go.

In your case, you can set up automatic trades in your account while you are in class to buy certain stocks with specific parameters that you set the night before. If your trade triggers hit but you find out the trade didn’t go as planned, sell the following day – not a big deal. Remember, it is not a bad thing to sell – too many novice traders think it is bad to sell if they are wrong. The best thing you can do is sell immediately when you know something is wrong – it saves you money!

Piranha

Intraday Trading Volume Question

MSW Member Question – Part #1:

Hello Chris,

I am new to MSW and also to investing in general. I had a question regarding breakout volume. Intra day, how is it possible to determine that there is above average volume? Let's say that early in the morning, the price is around 17.50 and the pivot/breakout point is 17.75, how is it possible to determine that there is above average volume for this particular stock so early in a trading day? I'm a bit confused. Also, I attend school for major parts of the trading day, is it even possible for someone like me to focus on breakouts if I can't be at the computer monitoring the stock and volume?

By the way, I'd like to say thanks for all your great screens. I have learned so much in just a few days.

Talk to you soon

My Answer:
There are two ways to go about this:
  1. I use Investor’s Business Daily (investors.com) volume calculation tool to simulate end of the day trading based on the total volume at a certain point during that day’s time. The tool is not perfect but it saves me time from performing my own calculations.

  2. Another way is to project the end of the day’s volume based on the number of shares traded at a certain point in the day.

For example, If XYZ averages 2 million shares traded per day over the past 50-d days, we can assume that the volume will be 50% larger than the average if the stock is trading 1.2 million shares by noon.

The earlier in the day we see the breakout above the pivot point, the tougher the task becomes to estimate what the final volume total will be when trading closes. If the average is 2 million shares per day and the breakout occurs at 10am with only 200k shares traded, we will not know what the final tally will be. In this type of a situation, I buy the stock anyway to grab it as close as possible to the pivot and then make my judgment when the day ends. If the volume was weak or if the stock reversed during the later hours, sell the following morning. Most individual investors use discount brokers so a $10 or $20 trading fee should not stop you from making the correct moves. If $20 hurts your trading stake, you should not be trading at all.

Also keep in mind that most stocks will trade move heavily during the first and last hours of the trading day so this will most likely skew the numbers when trading begins. Another important volume statistic to watch is the total weekly volume count as most stocks have higher volume during the breakout week than the prior week. IBD has been quoted as saying over 90% of all breakout stocks have higher weekly volume during the breakout than the prior week of trading.

    Piranha

        Wednesday, January 18, 2006

        Sirius Satellite (SIRI) Update

        I wrote a quick entry about Sirius Satellite Radio (SIRI) last November and spoke about the main reasons why I was staying away from buying the stock, even after the huge speculation placed on the company from the Howard Stern announcement. As we all know, the stock moved from $3 to $9 intraday before getting smacked back down in 2005.

        Reading my original post from 11/23/04,
        Sirius Satellite Radio (SIRI), you will see that I wasn’t very fond of the stock due to the fact that it was continually losing money. I specifically stated:

        “You won't see SIRI on our weekly screens because of the fundamentals”

        “I did not buy the stock for 2 reasons:
        1. I don't buy companies that don't show a profit.
        2. I currently have established positions in other stocks.”


        Sirius (SIRI) closed at $6.71 on 11/23/04 and is currently trading at $6.14 at 2:15pm today (1/18/06). It reached an intraday peak of $7.98 recently but has not lived up to the hype and speculation that everyone anticipated after the $500 million signing of Howard Stern. It moved briefly from $3 to $9 on the speculation but all stocks come back to what they are worth. In this case, (SIRI) is only worth $6. Buying in late November of 2004 would currently give you a slight loss and would have your money tied up in a dead stock with a media whirlwind. I’ll skip the media speculation and continue buying companies with increasing earnings, sales and profits. If I bought (SIRI), I would have missed:
        (FORD)
        (HANS)
        (AAPL)
        and others.

        I think you get the point.

        Piranha

        Tuesday, January 17, 2006

        All-Star Stock – Digesting Apple

        ...Apple has been on my screens for 15 months and has been in my portfolio on two separate occasions over those 15 months. The most recent purchase was last summer as it broke into the $40 range. The first screen Apple made on MSW was on 10/24/04 at $23.71 (split adjusted from $47.41 – my actual entry area). I first added Apple (AAPL) to my portfolio in late 2004 due to the strong fundamental and technical characteristics, as noted on this blog when it appeared on the MSW website. If you would like to go back and read that blog, please visit the archives from last January or click this link:

        http://marketstockwatch.blogspot.com/2005/01/green-apples.html

        At the time I wrote the blog entry from above, I noted how Apple had just shattered earnings estimates and had gained over 57% while on my screens. Many novice investors were just jumping on the bandwagon while I was thinking about getting off. This is what I said:

        “Many people went out and bought Apple today based on the great news from yesterday (Apple shattered estimates). I am not saying that AAPL can't go higher but I know from experience that it may be too late to join the party when the news hits the street and everybody knows, even the “dumb money.”

        Guess what happened? Apple went on to peak the following month (February 2005) and then went into correction mode for the next 5-6 months while I sold my shares for a profit and watched it from a distance. Are we starring at déjà vu?

        As the new base was forming, I stared to show interest to jump back into the stock in July as the right side of the cup was forming. The breakout came in August 2005 as the stock made a new 52-week high on volume larger than the previous week. At this point, I was already back covering the stock heavily on MSW and adding it to my portfolio. Two months later, the stock started to consolidate and tested the support level (the 50-d m.a. in this case). I told the entire community that I was a holder and they should do the same but the ultimate decision was up to each individual. Even though Apple (AAPL) was falling, the RS line was better than most stocks at the time as the general market was falling even more. I thought that Apple could be a leader if the major indices could make a turn-around in the fall. Besides, the stock recovered the moving average by the end of the week – a key signal of strength when looking at the bigger picture (see weekly chart below).

        Since adding the stock back to the screens in July, Apple has gained over 100% and has moved up into the $60-$100 range. Overall, a long term holder from my initial coverage in October of 2004 would have a gain of 260%+. Two weeks ago, I said this to the community: “trend buyers could add shares now”. If they did, they are now up an additional 12% from the latest breakout point.

        Apple will now enter the MSW All-Star list as I update certain members from 2005. The stock is looking to clear the final leg of the $60-$100 run. I rated the (AAPL) as a hold on the latest screen and wanted to mention that earnings are due tomorrow (Wednesday, January 18, 2006). Strong support sits lower in the mid $70’s but as I told one member in e-mail earlier today, never try to get out at the top. It is up to you to decide if the 100%+ gain is sufficient or if you would like to grab more. We haven’t seen red flags to this point so there is no urgency to sell but some investors get nervous before earnings are released. My gains are very large in Apple so I will hold through the release and make my decision then.

        As I said last year, I love the iPod and always use it at the gym and believe that the company will continue to create innovate products but never fall in love with a stock.

        Good luck and we shall see what the release brings us tomorrow. I don’t need to get out at the top when I have already met my objective!


        Piranha

        Monday, January 16, 2006

        What is a Stock Consolidation?

        MSW Member Question:
        Hi Chris,

        I look forward to checking out your website every day and thank you for all the valuable information that you provide. Please let me know what your definition of consolidation is. For example on 1/12/06 you mentioned this about HITT: “This is one to watch and grab at the first consolidation”. What is consolidation….how long does it last? Please explain.

        Thank you!

        My Answer:
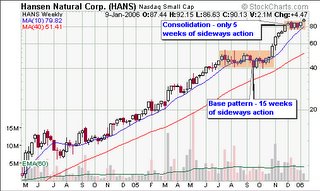
        My definition of a consolidation may be different than other traders but I will explain what I am talking about when I use the term. When I say a stock is consolidating, I am referring to a sideways movement or a pattern that is forming some type of base that allows the stock to correct back down to a moving average or support area after a previous up-trend. Hansen Natural consolidated sideways below $90 before the big push last week to complete the $60-$100 run. The pattern was not long enough in time (minimum of 7 weeks) to be considered a flat base so we call it a consolidation. As you can see on the chart below, the first pattern highlighted last for 15 weeks – a true base. The next area highlighted only lasted for 5 weeks, a consolidation in the bigger picture that allowed current stock holders to add additional shares.

        Most consolidation areas will have a support level and a resistance level with a breakout on a move above the resistance and a breakdown on a move below the support.

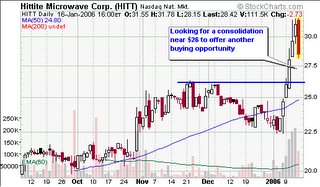
        In the case of (HITT), my analysis is looking for a pullback or consolidation towards the support area (the most recent breakout area). As you know, HITT is not on the MSW Index but may offer upside potential if you enter closer to the consolidation area.


        Piranha

        Sunday, January 15, 2006

        Sierra Health Services (SIE) Removed

        …As you already know, Sierra Health Services (SIE) was removed from the Index this week with a 58% gain on MSW over fourteen months. The stock peaked at $41.48 for a top gain of 69% and closed at $41.05 last week with a 67% on the MSW Index. I am removing the stock for two reasons:

        1. Its recent 2-for-1 split out of the $60-$100 run
        2. The recent violation of the 50-day moving average.

        I will note that it still has major support at the 200-d m.a. but I feel now is the right time to take profits. The support below dates back over two years so the stock can still rebound and move higher but sometimes it is better to take a profit than to hope to get out at the top. As a trader, you must act on that inner feeling from time to time, especially when a solid profit is involved.

        Sierra Health (SIE) challenged the 200-day moving average on five separate occasions over the past 14 months but I never had the urge to remove the stock until now. As I mentioned above, it may gather itself during the current consolidation and move higher but I just don’t feel right sitting around during this late stage base while new leaders present themselves.

        The only time I became concerned was back in September when the stock violated the 200-d m.a. intra-week but I left my emotions aside and decided to keep the stock until it violated a sell rule and closed below the moving average at week’s end. Also keep in mind that the market was going through a correction in September and the relative strength of SIE was better than most (even during the slide). SIE didn’t close below the line and the stock actually moved higher by 25% over the next several months on above average volume. The current relative strength is weaker than our new leaders so this may be foreshadowing of future performance.

        As you look at the chart below, you will notice that the stock has been churning slightly above $40 and has met strong resistance near $41. If the stock did not split, I would give it more of a chance to finish the $60-$100 run but that is no longer the case so I am moving on. It’s now up to you to decide what you need to do.


        Piranha

        Friday, January 13, 2006

        Hansen Natural (HANS) Does it Again

        …Hansen Natural (HANS) has been one of my best holdings over the past eight months. I originally picked up shares last May above $66 before the most recent 2-for-1 split. I told the entire community that “stocks that seem high to one investor may seem low to another”. This wisdom held true as the stock easily moved up through the $60-$100 range within a couple of months. The stock showed some red flags and stalling action near $100, so I sold my position and advised everyone to do the same before the stock dropped out of the $90’s (this was in July, 2005). The stock corrected over the next 14 to 15 weeks as I keep it on my back burner since it didn’t violate any long term moving averages such as the 200-day. It then broke out of this four month base in late October and I again grabbed shares and touted it as a $60-$100 candidate for the second time (since it split 2-for-1).

        I placed it back on to the MSW Index on November 5, 2005 at $57.63 and said that it had a very good chance to make a second $60-$100 run this year. Pre-split adjusted, I was buying back into the stock near $115 per share but I still thought it presented a great buying opportunity when looking to the weekly chart. The investors that thought the stock was too high in May at $66 probably thought I was crazy to buy back in at $115 (pre-split adjusted).

        Over the past two months, (HANS) has made great strides and has again completed the $60-$100 run with a powerful move today. My physical stop is placed at $89.89 but I am going to raise this stop slightly below $95 so I can guarantee myself a 60% gain minimum. It will remain on the MSW Index until it violates any sell rules or support areas even if I take my profits off the table. Without the split, today’s shares are worth over $200 from my first buy last May above $66 (a total gain of 203% in eight months). I guess the shares were low to some investors even through other less experienced investors thought the stock was too high. I don’t blame them because it was scary buying into a stock that ran up from $5 to $66 before I placed my first position.

        FYI: Last Saturday, HANS filled its spot on MSW Index with a closing price of $85.66 and I set a new breakout price of $88.39 from the recent consolidation. It crushed that area this week on above average volume.

        I hope many of you have learned to dismiss the idea that “high priced stocks” can’t give you excellent gains in a short period of time because this is completely untrue. If you want to argue, please see HANS and the other $60+ stocks that have made the run on MSW.


        Piranha

        Thursday, January 12, 2006

        How to Trade in Stocks - Jesse Livermore Quotes

        This entry will have fun and highlight some of the better quotes from Jesse Livermore’s book How to Trade in Stocks, one of my all time favorites (originally written in 1940):

        “Successful traders always follow the line of least resistance – follow the trend – the trend is your friend”

        “Wall Street never changes, the pockets change, the stocks change, but Wall Street never changes, because human nature never changes”

        “Just because a stock is selling at a high price does not mean it won’t go higher”

        “It cannot be said too often that in speculation and investment, success comes only to those who work for it”

        “I have long since learned, as all should learn, not to make excuses when wrong. Just admit it and try to profit by it. We all know when we are wrong. The market will tell the speculator when he is wrong, because he is losing money. When he first realizes he is wrong is the time to clear out, take his losses, try to keep smiling, study the record to determine the cause of his error, and await the next big opportunity. It is the net result over a period of time in which he is interested”

        “But careful timing is essential…impatience is costly”

        “The price pattern reminds you that every movement of importance is but a repetition of similar price movements, that just as soon as you familiarize yourself with the actions of the past, you will be able to anticipate and act correctly and profitably upon forthcoming movements”

        “All through time, people have basically acted and re-acted the same way in the market as a result of: greed, fear, ignorance, and hope – that is why the numerical formations and patterns recur on a constant basis”

        “The game of speculation is the most uniformly fascinating game in the world. But it is not a game for the stupid, the mentally lazy, the man of inferior emotional balance, or for the get-rich-quick adventurer. They will die poor.”

        “Markets are never wrong – opinions often are”

        “Remember too that it is dangerous to start spreading out all over the market. By this I mean, do not have an “Interest in too many stocks at one time. It is much easier to watch a few than many. I made that mistake years ago and I cost me money”

        “There is nothing more important than your emotional balance”

        Piranha

        Tuesday, January 10, 2006

        Let the Stock Predictions Begin

        ...The “Talking Heads” are at it again as the DOW topped the psychological level of 11,000 yesterday. I read several articles and heard several analysts predict that this year will be great due to the action over the past five days. One analyst predicted a new all-time high with the DOW topping 12,000 at some point. Now, this isn’t a stretch but I still don’t understand how these “so-called” experts haven’t learned their lesson in the past by trying to predict what the market will do over a twelve month period of time. They have been wrong so many times in the past; you think they would learn from their mistakes. We currently know the market is trending higher and until further notice, we have a bullish outlook but I am not going to step out on a limb and predict a “great year” after one week of trading – that is pure ignorance.

        In my opinion, only an amateur or a non-trader would say something like that (hence, the mainstream analysts). These guys don’t trade for themselves and we all know this because they must disclose if they are trading in a specific security that they have written about. If you look to the bottom of each article they write, it usually says “at this time, the author does not hold any of the securities mentioned above”. Of course not, they don’t trade, they BS the public. I don’t disclose every trade I make but I do talk about many of the moves I make and I have been wrong in front of this entire community (it happens – that’s life). Read what one analyst had to say yesterday:

        "A strong close today is going to be suggestive of a strong year," said Joseph McAlinden, chief investment officer at Morgan Stanley Investment Management, on CNBC's "Street Signs." He expects the Dow to clear 12,000 this year, which would eclipse the Dow's all-time high close of 11,722.98 on Jan. 14, 2000.

        So a strong close yesterday signals a strong year according to this analyst. Really, since when does one day of action predict an entire year of trading? That answer would be never!

        Here is an insert form Investor’s Business Daily (today’s edition):

        “There's no way to accurately predict what will happen the rest of the year based on five days of trading. The NASDAQ motored 7.5% in the first 3 1/2 weeks of 2004. It then dropped nearly 19% in the next 6 1/2 months...”

        I guess the analyst has a short term memory or doesn’t have any true experience trading in the market; otherwise he wouldn’t make such a novice statement. I don’t to mean single out this one guy and I don’t know who he is but the quote is entirely unnecessary. If the market does rise this year, he will be considered a genius by his non-trading peers. If it goes down, they will blame it on outside conditions or uncontrollable factors while giving him a raise next year. The chance of him being right is 50/50, not bad odds when nothing is on the line (unless he plans to load up his portfolio based on his observation over the past five days).

        Bottom line: be aware of who you take advice from and always do your own research and analysis. Also note that many of the market leaders made intraday reversals from their highs yesterday and both the DOW and NASDAQ moved higher on below average volume (two very minor red flags). The daily screens get into more depth about these topics and the strongest NH-NL ratio since last July.
        Piranha

        Sunday, January 08, 2006

        Recent MSW Index Results

        ...I was recently asked about new additions to the MSW Index (weekly screens) over the past couple of months. In response to the question, I sent this member the results of our stocks from October and November (2005). I told him that our stocks typically take a couple of months before they start to show solid gains. After going through a brief analysis of the stocks added to the screens in October and November, I wasn’t surprised to see an 85% success ratio for the 13 stocks selected. Of the 13 stocks added to the screens during this period of time, only one has been removed to date (PWAV) due to a loss. The stock was removed due to a violation of the Index 10% sell rule. Another stock has been removed (KNOT) but it was showing a 2% gain when it was cut yesterday. I decided to remove the stock before the very small gain turned into a loss. SSAG is the only stock from these two months to currently show a loss at 1%.

        Together, the 13 stocks have an average gain of 26%, very impressive if you ask me. Below is a simple table to display the results of the stocks added to the MSW Index in October and November:

        *Stocks in red have been removed from the MSW Index

        10/1/2005---Then---Now---Gain/Loss
        (LMS): $18.32 $27.69 51%
        (SSAG): $17.60 $17.38 -1%
        (GMXR): $26.27 $35.87 37%
        (PWAV) : $12.99 $11.26 -13%

        10/15/2005
        (ESRX): $61.16 $89.82 47%

        10/29/2005
        (CRDN): $37.89, $46.62, 23%
        (KNOT): $11.37, $11.62, 2%
        (CTRN): $27.40, $40.80, 49%
        (TWGP): $18.53, $22.21, 20%

        11/5/2005
        (HANS): $57.63, $85.66, 49%
        (NWRE): $20.30, $27.15, 34%

        11/12/2005
        (NETL): $23.56, $27.15, 15%
        (OXPS): $21.81, $27.36, 25%

        Be patient with our MSW Index stocks and don’t expect them to gain 25% or more within a few weeks, this is not very typical. Also keep in mind that we don’t day trade, we trade within a time from of three months to twelve months (or more in certain situations). If a stock violates a sell rule, we sell immediately, even if it is only one day after we purchase the stock.

        If the start of 2006 is as kind as the fall of 2005, I hope the recent editions to the MSW screen will provide us with similar results in two months.

        Piranha

        Friday, January 06, 2006

        What happens to “buy and hold” stock investors?

        ...I have always argued that you must cut your losing positions because they may take years to come back if they ever break even. Back in the 1930’s, RCA was the top touted stock but it took 30 years to break even from the 1932 price level. Ever hear of Enron, Worldcom, Lucent, etc… Two of these will never return a break-even investment for their holders and one may take another 5, 10, 15 or 20 years to break even (if ever). Lucent traded above $60 in late 1999 but has since traded in the $2 range. I know of a family member that went crazy buying up shares in 2002 and 2003 while it traded between $1.50 and $2.50. I know she still owns these shares to date and I told her not to do it and even sent her a free trial subscription to IBD in 2002. The stock closed at $2.77 yesterday. I know she is showing a profit but I also know she has locked up large sums of money in a dead stock that she is “hoping” will come back. She lectures me that I am a risky investor but I laugh to myself because LU may never make a watch list of mine ever again. I know she won’t read this so this is why I write about the topic.

        Last night, two familiar stocks crossed my daily screens that were flying high in the late 1990’s and early 2000’s. The first stock, NVDA, was one that I owned many years ago as I was learning about video cards, photoshop and other large software programs that required cards from this company.

        I was working with an architectural firm in Connecticut when I had a discussion with the principal owner about a company named Nvidia. This architect traded in the market seriously but on a casual basis in my opinion. While reading a magazine, he saw a story on Nvidia and how they were stealing market share from ATI and the other leaders at the time. Their technology was by far the best on the market and they were extremely innovative compared to the industry leaders. Based on that article and the fact that his firm just purchased computers with these chips, he immediately bought several hundred shares.

        As I remember back, he loved high tech companies as did everyone and bought shares of Intel (INTC) and Cisco (CSCO) for each of his nieces and nephews on their birthdays. He would always say that they would thank him when they turned 18 and needed money for college. His quote was something like this: “If I give them $100 now, they will blow it in one shot at the mall; if I buy them shares, they may hate the gift now but will understand when college tuition is knocking on the door” and then he would say: “Intel & CSCO will never go down”. – Big mistake! This was the “buy and hold” mentality, even during the crazy 1990’s. Looking at a 5-year chart for Intel, the stock has not recovered the highs of 2001 and sits at a loss for shares purchased five years ago. Cisco is no where near its former highs of $70, $80 and $90 (it closed at $18.35 yesterday). I hate to say this but those nieces and nephews are showing losses (from the original installments of $100) that become ever bigger when you consider depreciation of the dollar and some inflation. The buying power of the $100 from 5 years ago is not the same today. If he bought them a mutual fund or invested into their education IRA’s, they may have made some nice profits.

        Looking at his other stock, NVDA, he made a lot of money buying and selling because he felt NVDA was a fad, different from Intel. I don’t know if he ever sold his entire stake but if he didn’t, he would only be breaking even this week from shares purchased in May of 2002. Shares bought in early 2002 would still be showing a loss, four years later. I can’t imagine locking up my money for four whole years while a stock is sitting there doing absolutely NOTHING. On top of the stock doing nothing, he would have missed the education stocks of 2002, the builders stocks of 2002, 2003, 2004 and the final leg in 2005. He would have missed CECO, COCO, HOV, TOL, NVR, CTX, LEN, APOL, TZOO, TASR, FORD, URBN, APPL, RIMM etc. as the list goes on. No one person owned every one of these superstar stocks but the chance that he may have bought one or two of these market leaders exists.

        The other stock making the screen last night (also a former MSW Index stock in late 2005) was NDS Group (NNDS). The stock closed at its highest level since June of 2001. To make an all-time high and allow some investors to break even if they are still holding from 2000, it would require the stock to gain $30 from the current $44 level.

        I only provided a few short examples but you get the idea of the article. Don’t ever think for one minute that today’s leaders will be tomorrow’s leaders and that buying and holding is the ultimate answer. Turn to mutual funds if you prefer the buy and hold strategy. At least these fund managers will sell their poor performing issues and give you a “chance” by adding current day leaders.

        The moral of the story: have sell rules and never hold a losing position!

        Piranha

        Thursday, January 05, 2006

        General Market Analysis

        ...I started the daily screen commentary last night with words of wisdom about past trades and I posted up a great quote from a great poker player. Why would I use a poker analogy with trading in the markets; because I believe they are very similar. For more on the similarities, you can visit my blog article on the subject:
        http://www.marketstockwatch.com/2005/07/poker-and-stock-market.html

        As for the quote, I will repeat it here for everyone:
        Said by the Matt Damon character in the movie Rounders:
        In "Confessions of a Winning Poker Player," Jack King said, "Few players recall big pots they have won, strange as it seems, but every player can remember with remarkable accuracy the outstanding tough beats of his career." It seems true to me, cause walking in here, I can hardly remember how I built my bankroll, but I can't stop thinking about the way I lost it.

        The quote couldn’t be truer when I think back about my winners and losers over my trading career! I am not a high roller when it comes to poker but I do remember specific hands that I have lost when I calculated a win in my head (based on the odds I was betting).

        If you had any tough beats in 2005 while trading in the markets, sit down and face those losses and don’t let them haunt you in 2006. Understand why the trade went bad and analyze how and why you reacted the way you did. Write down and think about how you can correct these past mistakes so you can try and avoid them in the future. It doesn’t matter how many years of trading experience you have because mistakes will always happen. The game of investing is not about winning and losing, it is about playing the odds and managing your money so you don’t get one of those bad “beats”. The same holds true for poker when playing over a long period of time.

        Looking at the NASDAQ, we can see that it held support at the critical 2,200 support line and has raced ahead by 70 points at 2:00pm on Thursday. Volume will come in higher this week versus the past two weeks due to the holidays so it won’t play such a big role when looking down upon it as accumulation. The more important statistic that shows the market is gaining some strength this week is the number of stocks making new highs. Last night we just missed 500 new highs, a critical signal to let us know that the market is gaining strength. If the NASDAQ closes higher today, it will represent the third straight session with a gain as it approaches its 4 1/2 year high.

        The DOW broke the support line of 10,750 last week but has managed to recover the line this week in nice fashion. After the big gains on Tuesday, the index is up over 150 points this afternoon as I write this analysis. The price relative to the S&P 500 is still at multi-year lows but that does not matter so much because the S&P 500 has been outperforming the DOW. A quick look at the yearly chart for the S&P 500 will show you that it has held its support line similar to the NASDAQ, hence the strong RS lines for these two indices.

        Tonight I will cover the close of the indices today and will take a closer look at the handful of MSW Index stocks that are near major moving averages (buying points from the past two years).

        See you tonight,
        Piranha

        Question about Coach - COH

        ...Today’s question comes from an MSW member that owns shares in Coach (COH), an MSW Index stock for many months. We told you that the pivot point sits at $36.94 and the triple top breakout has now setup with a move above $37. On the flip side, strong support sits at the $30 area, below the 200-day moving average. Below is what I had to say earlier in the day:

        MSW Member Question:
        Chris,
        Well, is it time to bail on Coach? Several ugly days on volume and I am negative. Should get xmas sale results soon, either help or kill the stock.

        Thanks.

        My Answer:
        Looking at a two year chart, the stock has held 200-d m.a. every single time (exactly where it is now). If you are personally questioning the stock and feeling uncomfortable: at least take down half of your shares. Remember, you can always get back in. If you are very uncomfortable, sell it all and reassess the situation with an unbiased approach.

        Look at this way: If you didn’t own Coach, would you enter right now?

        Look at the two year chart:

        http://stockcharts.com/gallery/?coh

        I don’t want to influence your decision either way but I know momentum traders are buying at this point due to past performance at the 200-d m.a.

        Again, sell half and let it prove itself if you are worried. Good Luck with your decision.

        By the way, support is $30 and breakout is $37 and yes the holiday numbers will make or break the stock near support.

        Piranha