Market Talk with Piranha is currently moving to its new home at chrisperruna.com. The new site is up and running but many of the posts need editing as the images and stock charts did not transfer successfully (thanks blogger). I will post all new entries to both blogs – Thank you for your patience while I make this change!

Monday, July 31, 2006

Listen to Martin "Buzzy" Schwartz The Interview

I found an interesting interview of Martin “Buzzy” Schwartz while searching the web last night. It is provided by a site named annonline.com and can be found through this address: The Interview

I mentioned that I read the book Pit Bull: Lessons from Wall Street's Champion Day Trader by Martin Schwartz over my last vacation and enjoyed it very much since it is very different than most stock market books. He tells his story and gives some advice at the same time but I viewed the read as entertaining and extremely insightful.

I enjoyed the interview even though I would have asked different questions so now I want to share it with you. First I will recap some important facts that I wrote down while listening:

I believe the interview took place in the summer of 1998 prior to the 2,000 point drop on the DOW in the fall of that same year. The October 1998 low near 7,300 pushed towards a record high just below 12,000 in January 2000.

He mentions that the DOW is trading near 9200 during the interview and says “I have trouble understanding how we can march unabated.”

The market is “selling at 5.3 times book value – record high…”

This great trader knows that things are not right and that the market is overdue for a correction but he specifically states that you must follow the trend and avoid picking a top. This is supreme emotional and psychological control by one of the best traders of our generation.

He is quoted as saying: “Don’t fight the trend despite the fact that we are at historical highs.”

Buzzy goes on to say “we are at the high end of the valuation spectrum” and “difficulty is that we can be hit with something from left field and we are overdue for that.”

As a trader and not an investor, he points out that the market was better suited for his style of trading during the 1980’s when it moved back and forth (taking advantage of the long and short side). He doesn’t like the constant push higher that everyone witnessed in the late 1990’s.

He talks briefly about his methods and says that he’s not in the business of giving advice and doesn’t feel comfortable giving advice to other traders. But, he mentions that he uses a 10 day exponential moving average with red light and green light signals (above the moving average is a positive green light and below is negative or a red light).

He uses his own type of money management with a risk parameter set in dollars. He will cut a trade when the dollar figure is violated.

Ann goes on to ask him if he ever breaks rules and as expected (we are all human), he says yes and blames it on emotions and stubbornness.

As many traders already know, the bulk of your profits are made on a minimum number of days throughout the year. Schwartz says: “200 days per year are about even. About 50 days per year is where my big money is made.”

Ann asks him what’s the most he has made in one day and he responds: “several million”. At one point in the early 1980’s, he was making $70,000 per day trading the S&P’s. In 2006, $70,000 a year is still considered a good salary!

Finally, he talks a bit about setting up a plan and putting it on paper before quitting your job and aspiring to become a full time trader. There’s more detail in the interview and in the book so I’ll let you find out for yourself.

He ends the interview by answering this question:
Ann: Can anyone do what you have done?
Martin: “Few can do what I have done” “rare set of skills and honesty, along with intelligence”


Publisher’s weekly describes the book as such:
After working several years in what he considered to be a dead-end job as a financial analyst at E.F. Hutton, Schwartz quit the firm, accumulated a nest egg of $100,000 and on August 13, 1979, bought a seat on the American Stock Exchange where he began trading stocks, options and futures. He quickly became an expert at trading S&P futures, and in his first full year as an independent trader made $600,000 and a year later earned $1.2 million. Schwartz's style was to get in and out of positions in a hurry; he rarely held on to any financial instrument for more than a day. As his success on Wall Street grew, he began his own fund in which he would manage other people's money as well as his own, a move he would regret. The stress of running the fund contributed to his developing pericarditis, which nearly killed him. His doctors advised him to slow down his lifestyle, so at the age of 48, Schwartz, along with his wife and two children, moved to Florida where he took up golf and developed a daily routine that allowed him to keep trading, but at a more relaxed pace. This is one of those rare autobiographies where the subject unintentionally portrays himself in an unfavorable light. As he grew ever richer, Schwartz became consumed with generating even more money and prestige so that he could "run with the top dogs." Inadvertently, he has written a cautionary tale on the dangers of being addicted to money and power.

Piranha

Friday, July 28, 2006

The Dog Days of Summer

You can really tell that my trading has come to a halt. I added my dog into the poker picture below! Now, that’s what I call a good looking lab! By the way, I used Photoshop, one of the best programs ever.


The original:


Piranha
What can I say, I love dogs and poker!

Thursday, July 27, 2006

Listen to your System

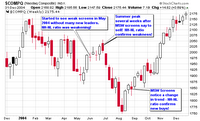
As I highlighted in the blog post yesterday, my system alerted me that the market was going to take a turn south in the summer of 2004 and it did (May, June and July). It is important for every trader to have your own system that alerts you of moves which allows you to profit. It can be short term, long term or anything in between but you must understand what it is saying. I depend on the price and volume of the major indexes, the NH-NL ratio and the action among the individual leaders to determine if the market is strong or weak. Since I have studied these patterns for years, I know when the market is moving higher or lower based on the confirmations each of these indicators give me. Nothing is exact but they are extremely accurate as they guide me with test buys, position sizing my trades and moving me to the sidelines.

Take a look at how these three major indicators got me in and out of the market in 2004 (and keep in mind that I am not a day trader – I was momentum trading, trend trading and swing trading in 2004 – which ever you would like to call it).

I wrote this entry on my Weekly Screens on April 19, 2004 (the highs on the NASDAQ in April 2004 were not revisited until November of that year):

Market Overview: The market is still in a confirmed rally according to rules but we are seeing many stocks hesitate and undecided about their direction. The world situation has been a big influence on the general market conditions. Speculation of an interest rate hike has kept the market in flux.

My screens showed bad news last week with the daily new highs and lows. For the first time since posting my screens in November (2003), the daily new highs were lower than the daily new lows. I haven’t seen action like this since the bear market.”

I posted a weekly screen insert in yesterday’s blog post from July 2004 which warned that the market was still heading lower. The MSW screens turned negative in May 2004 and stayed that way until late August 2004 as you will read below.

WEEKLY OVERVIEW of 8/16/04 to 8/20/04:

“…However, I am possibly seeing a new trend that may be starting to form in the indexes. You heard it here first. I may be early but I am seeing a change in my screens. (Please note, I saw the trend in March of 2003, especially April of 2003 – I posted in real time on this breakout simultaneous with IBD). I was tipped off by the “new highs vs. new lows” combined with the huge institutional sponsorship that was sending stocks to new highs.

The DOW was up just short of 3% from Friday (13th) to this past Friday (20th)
The NASDAQ was up 4.5% in the same time period
I have noted that volume was extremely weak.

The New Highs vs. New Lows picture looked different than past weeks.
We had 3 days out of 5 that had more new highs.

On 8/13, we had – NH-37, NL-304
On 8/20, we had – NH-128, NL-53

I know this is minor but it may be the first signs of a changing atmosphere. Stayed tuned as I will keep a close eye on this change in my screens. (I have done my daily analysis for Monday, August 23, and I see more encouraging signs in the NH vs. NL list: 131 vs. 46). Again, volume was weak. When the charts and volume cooperate with the new highs list, we may be half way to a new up-trending market.”


Looking at the chart from 2004, I guided traders out near the top of the early summer decline and I guided them back in at the beginning of the late summer/ fall advance.

More recently, I took investors out of the market in mid May 2006 and hope to have them back in when my screens confirm the rally in the future. When will that be? I don’t know but my research will tell me as it has every time in the past.

If you would like to review my work on the MSW screens, I invite you to explore my past archives from 2004 and 2005 as they are open to the public. You can review a chart as you read everything I have written over the past two years. The archives for 2006 are for members only but will open to the public when the year ends. Using my three main indicators, I have been very successful by getting in and out of the market since late 2002. Prior to 2002, my system was not as strict as it is today but I learned my lesson by getting slammed in 2001.

Develop a system, hone that system and understand what it is trying to tell you and you will come out with a profit. Every trade can’t be a winner but you won’t be fighting the trend because your overall system will tell you what side of the market to trade.

Piranha

Wednesday, July 26, 2006

Déjà vu on the NASDAQ?

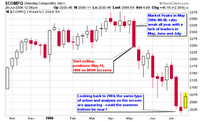
As I was researching my archives on MSW (the archives from 2004 and 2005 are open to everyone) I found some interesting data that correlates the NASDAQ in 2004 and 2006. So far in 2006, we have had 15 down weeks and 14 up weeks. At this time in 2004, we had 19 down weeks and 10 up weeks and the NASDAQ was at a nine month low (very similar to now as we are near 10 month lows). In 2004, my daily and weekly screens started to turn south on May 9th; in 2006, they started to turn south on May 15th (about the same time).

If you look at the two charts presented in this blog entry, you will notice how the market started to weaken in May and June and with a bottom near the end of July into early August. This summer is not over but I am wondering if the pattern will turn out to be similar to the one from 2004. The old saying: “sell in May and go away” has held up over the past couple of years with opportunities presenting themselves during the fall (towards the end of October).

Several of things I was saying back in 2004 are very similar to what I have been saying over the past two months. The similarities are amazing and the current NASDAQ chart may be forming a pattern that could take a similar route as it did in August of 2004. Only time will tell but history repeats and traders are always learning from history.


NOTE: when I say history repeats; I am not saying that it repeats exactly but the charts do resemble similar formations and seasoned traders and investors can capitalize on these situations.

Here is my exact analysis from July 2004, very similar to things I am saying today (2 years later).

“WEEKLY OVERVIEW of 7/19/04 to 7/23/04:

I am starting to sound like a broken record. The Dow was down for the 5th consecutive week. The NASDAQ is now at a nine month low.

Quote from IBD regarding the NASDAQ:
“Out of 29 weeks of trade this year, excluding the week ended Jan. 2, 19 have been down.”

I ran my screens this past week with a few stocks making some daily cut offs – barely. When I ran my final weekly screens last night, I came up empty. Not one possible candidate that legitimately makes my watch list. I must scratch my head when I see people listing dozens of stocks for potential buys in this type of environment.

Anyway, I have my own system and that is all I can talk about right now and this system is telling me to be patient, be very patient. Every red flag has been raised over the past 3-4 months.

Anyone that has followed my screens would have noticed that things were going south when I stopped posting individual stock lists after May 9th. How could I, quality stocks were not around. I would be doing an injustice to the people that follow my screens if I just posted any old crap for the sake of posting.

Now, let’s be patient – patience is one of the most sacred virtues of a stock market investor. Jesse Livermore once said: “It’s not your thinking that makes you money, it’s your sitting”.

Here are some insight about market corrections:
Market corrections are healthy, allowing it to breathe. Corrections allow stocks to shake out weak holders and allow stocks to form proper bases. Corrections allow stocks to resemble their actual value more closely. Market corrections and flat markets allow intelligent investors to study conditions carefully while they sit on the sideline patiently awaiting the defining trend. Money is made on the big moves, not the minor day to day moves. Corrections allow big moves to establish themselves.

During bear markets or general market corrections, it is essential to keep up your watch list as many future high flyers are building bases during these times. Stocks that correct the least and sport the highest relative strength lines tend to be the leaders of the next bull market. Take note of all stocks that are base building during corrections, a cup with handle or flat base are the most popular.

How can you spot a correction or bear market on the horizon
• The major indexes will advance on below average volume.
• Stocks making new 52-week highs will be limited.
• Stocks making new lows will increase.
• Major indexes will fall below the 50-day MA and/or the 200-day MA.
• Index averages will start to under perform. Relative strength lines will head south.
• Major publications will tout hot stocks at key market reversals (market tops).
• Smart money will bail in huge volume. Down days on excessive volume above average.

NO STOCKS LISTED THIS WEEK, REFER TO PREVIOUS WEEKS”
-7/26/04

Just a note: I didn’t add any new stocks to the MSW index last week (7/26/06)!

Piranha
Labels:

Monday, July 24, 2006

Ticker Sense Sentiment Poll

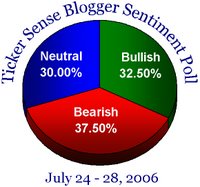
I want to draw everyone’s attention to the Ticker Sense Sentiment Poll since I am now a participant.

What is this poll?

The Ticker Sense Blogger Sentiment Poll is a survey of the web's most prominent investment bloggers, asking "What is your outlook on the US stock market for the next 30 days?" Conducted on a weekly basis, the poll is sent to participants each Thursday, and the results are released on Ticker Sense each Monday. The goal of this poll is to gain a consensus view on the market from the top investment bloggers -- a community that continues to grow as a valued source of investment insight. © Copyright 2006 Ticker Sense Blogger Sentiment Poll.

Justin Walters and Paul Hickey co-founded and developed Ticker Sense in the fall of 2005 in hopes of providing more and more individuals with the type of research that they produce at Birinyi Associates, a financial research and money management firm.

It will be interesting to see how accurate this poll will be moving forward as compared to other major polls. Most of the bloggers included would call the main stream analysts “talking heads” as I already do but are we becoming “talking heads” by developing this poll. I’ll say no for now! In any event, bookmark their blog because they produce excellent material.

Piranha

Friday, July 21, 2006

Ten Stocks to Watch

The NH-NL ratio finished at 97-182 on Thursday, staying on the negative side, reminding us that a rally is not taking place. Sellers continue to have their way with a 3-to-1 advantage during Thursday’s session as the NASDAQ gave back 2% (all of Wednesday’s gain) but volume was lighter. Staying on the topic of “large caps”, I noticed that Apple gained 12% after reporting bullish sales, Google fared better than Yahoo but is only up 0.49% heading into the final hour of trading on Friday (under both the 50-d m.a. and 200-d m.a.).

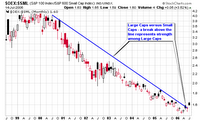
The S&P 100 Index/S&P 600 Small Cap Index that I track is up over 6% this week for its largest gain in years, confirming that large caps are moving to the head of the class. Investor’s Business Daily pointed out how CBOT (a stock I have highlighted on this blog in the past) blew past expectations but couldn’t gain much ground throughout the day after reaching a high of $126. The stock is actually down 3% today, telling us that buyers don’t have a chance, at least not now. The stock has formed a V-shaped cup with handle with a pivot point of $124.58 (breakout volume should reach 600k shares).

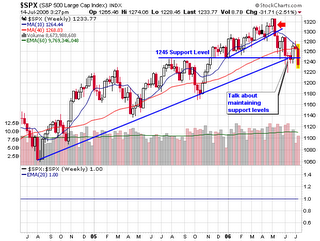
If the NASDAQ closes where it is right now, it will have its lowest close of the year (the lowest since May 2005). The S&P 500 index challenged its former support (now resistance) of 1,245 earlier in the week but looks set to close below this level within the next hour. Crude has dropped the past four days and attempted to climb back above $75 earlier in the day but looks like it too will close below former support (now acting as resistance).

So, are there any stocks out there to consider for a watch list?

Here are 10 to Take a Look at:

  • ADS – the stock has been falling for three straight weeks but I told MS members that this could be the case since it had to fill the gap from April, something it may be doing (down to $47.50). If it bases here (or gets support), I am buying several calls to speculate on my idea of a bounce.

  • GRMN – down over 2% for the week but the stock continues to hold the 50-d m.a. as support while maintaining a presence near the psychological triple digit threshold. I still like the stock in a rallying market (could make a nice option play for a solid run).

  • LVS – the stock is trading between a range of $65 and $74 (with some higher ticks) but it still sports a solid relative strength rating and solid fundamentals. The $60-$100 run is still a strong possibility

  • ZUMZ – trading in a range of $30 and $37.50 for the past 12 weeks with some minor intra-week movements above and below the major range. The most recent breakout of $36 was reversed but who can blame the stock in this type of market.

  • EZPW – filled the gap back down to $38 and is now trading between this level and the high above $45. I would consider this a handle to a longer pattern that could give us a nice run if the market were to breakout.

  • ARP – trading in a range between $32 and $39 for the past 18 weeks, all above the 200-d m.a. The stock has a supporting relative strength rating that suggests it can move higher in the next rally.

  • MAA – an 18 week base that has held up for the most part during the past two months as its relative strength rating continue to soar. A breakout to new highs is a buy point on the point and figure chart ($58).

  • ORB – the stock has been acting very well this week amid the negative tone among the other leaders and the major indexes. It managed to gain more than 5% during a weak of turmoil and it did so on heavier volume (above average). With the strong moves above $16, the stock is now slightly extended but one to continue to watch.

  • MED – the speculative stock that made us money earlier in the year is now forming a sideways consolidation base, one that has lasted for seven weeks. The support seems to step in near $16 with the weekly breakout above $20. Of all the stocks listed, this may become the best play for pure traders.

  • CSH – the stock has formed an 11-week cup shaped base without a handle. It attempted to breakout over the past two weeks but has not succeeded due to the weak market but this could be beneficial as it might form a proper handle. With today’s intraday low, the stock has basically filled the two gaps from earlier in the month.


Piranha

Tuesday, July 18, 2006

Large Caps Gaining Strength?

McDonalds made it’s first ever MSW daily screen last night after it said that second quarter earnings should jump by 60%. For the day, the fast food company was up over 5% while other large cap stocks also gave the street solid earnings reports. Apple moved more than 3% after comments were made by a “talking head” over at Piper Jaffray prior to an earnings release on Wednesday. IBM, Microsoft and Yahoo are all expected to report results in the coming days. The chart associated with this post is telling us that Large Caps are gaining strength versus Small Caps. Time will tell but yesterday could have been the first round of confirmation.


I thank Trader Mike for bringing this chart to my attention!

Some familiar "Large" names expected to report today:
KO – Coca-Cola
JNJ – Johnson & Johnson
IBM – International Business Machines
USB – U.S. Bancorp
YHOO – Yahoo, Inc.

Piranha

Monday, July 17, 2006

MSW Market Overview

This post contains a portion of the general analysis from the MarketStockWatch.com Weekly Screen: 7/10/2006 to 7/14/2006

Said on last week’s Weekly Screen Analysis (7/8/06):
“I still have doubt in my mind about this rally because it didn’t confirm within seven days.”

I want to start by stressing the importance of paying attention to the overall market (a statement I made to start last week’s analysis). If the market starts to pullback, so will the majority of stocks (another repeat statement). It will be very important to watch the leading stocks to see how they react to any corrections and/or pullbacks (a third statement from last week – this statement told us to sell test positions turning against us as noted on the daily screen on Wednesday and Thursday). So what do we do and how can we gauge what’s going on in the market?

I am looking for stocks that are holding up better than the major indexes. Stocks that fall less than the overall averages is a good place to start. My first list to check is the MSW Index, then the MSW watch list and finally I will search the daily screens and overall market for stocks that look like leaders based on their recent relative strength (when I say recent, I mean the past 5-8 trading days).

To start; how much did the major indexes fall?
NASDAQ: -4.4%
DOW: -3.2%
NYSE: -2.5
S&P 500: -2.3

Looking at the MSW Index, we see that every stock fell for the week, so which ones dropped the least?

GRMN: -1.75%
TS: -2.71%

These were the only qualifying stocks from the MSW Index that fell less than the major indexes. Garmin (GRMN) fell less than every major market index and found support near $95 and the 50-day moving average. It did qualify for distribution, the first in 13 full weeks. TS was strong but the stock has formed a trend line that is pointing down (I will add this trend line to the weekly chart; it can be seen best on the daily chart).

Looking at the MSW Watch list from last week, we see one solid stock:
KNOT: -1.29% (down less than the major averages)

With this in mind, we see that only two stocks maintained their leadership status based on this analysis but several of them are still above key support levels and will remain on the MSW Index because they are still better than most of the options out there. Only two stocks on the MSW Index contain RS ratings less than 90 (CME and ADVS with 89 and 88 respectively). Only one stock from the watch list last week currently holds a RS rating less than 90 (BLKB with an 86 – no longer listed).

Last week I said this: “Although the ratio turned positive, we ended on a sour note with the only negative daily reading of the week on Friday. We had our fewest new highs of the week and our most new lows for one day of action. Sprinkle in the fact that both the DOW and the NASDAQ fell 1.2% on slightly higher volume and we can start to become concerned if we have open positions.”

The foreshadowing was written on the wall with new lows expanding as the week wore on. We logged another negative NH-NL ratio with the weakest rating since the week ending June 17, 2006. We also witnessed the second most new lows logged in one week for the entire year of 2006 with only June 17 higher with 310 (the only week above 300 since October 15, 2005). With the market breaking down and the NH-NL ratio confirming, we are in some serious trouble. I have closed my test buys and moved back to cash (except for several long term option positions) and I advise that you all take serious looks at any stocks you may currently own. The sharp reversal in the market was not a surprise and I was not hurt much at all since I was only placing positions about 1/3rd my typical position size. This is the exact reason why I place test buys; all indicators weren’t in sync (specifically the NH-NL ratio).

Follow our three most important Indicators:
1. The price and volume of the major indexes
2. The action on the NH-NL ratio
3. The action among leading individual stocks

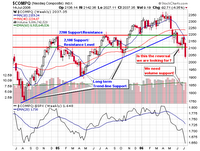
As we already know, all three indicators are extremely weak and all three indicators are heading down! The NASDAQ is at a nine month low and has violated all recent support; starting with 2,200, then 2,100 and then 2,050. The relative strength rating is at multi-year lows and is pointing straight down (a very steep drop over the past two months). The next low would be near 1,900 which was set back in April 2005. Looking at the retracement levels, we see that the NASDAQ has violated the 61.8% level of 2,178, the 50% level of 2,125 and the 38.2% which sits at 2,071.9. Based on all the information at hand, I would expect some type of bounce on Monday but that’s not a given especially since the Trader’s Almanac states that most Mondays are down after a negative Friday. We are definitely in a correction because the NASDAQ is down 14.2% since its 52-week high and 7.6% since January 1, 2006.

The DOW and S&P 500 have also violated all support levels but are in much better shape than the NASDAQ. The S&P 500 is only down 1% for the year and 6.8% since its 52-week high. I tend to rely on the NASDAQ more so than the DOW but it is interesting to see that large caps are gaining some steam while small caps are getting trounced. I have two charts posted on page two of my charts link that show the transfer of strength going from small caps to larger caps.

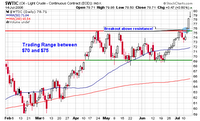
The larger story lies with crude oil as it hit an intra-week high of $79.86 while closing at $78.71. Crude showed a large intraday reversal on Friday but still closed with a slight gain for the day. It broke out above the $75 resistance this week and was helped by the tensions in the Middle East and growing tensions with Korea. As long as missiles are being fired in the Middle East (outside of Iraq), crude and gold will travel higher while stocks struggle to hold their ground.

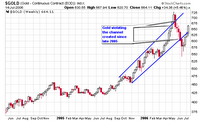
Gold reached a low near $550 but has now retraced about 62% and is trading back within the channel lines that date to 2005. Using retracement level logic, we would think that gold would pullback at this time but world tensions may change the formula and change human psychology.

All in all, we had a very negative week and I have no idea what next week will bring but I do know that I can’t lose much money because I don’t have much of it risked at this point in time. With that in mind, I am able to sleep at night without worrying if my account will be slaughtered tomorrow or the next day. I have moved portions of my cash to alternate investments while the market is taking its sweet old time to rally higher and urge you all to speak with your accountants and/or financial planners to do the same. These are not high interest investments but slightly better than the basic money market rates available. I have also been researching housing prices here in NJ because I know that the big builders are having trouble selling their back-log of homes. It’s still early in my opinion but I look to purchase several properties over the next few years to build an additional investment patch and/or income stream (this idea is still in the works).

Below is an updated look at the weekly averages for the NH-NL Ratio:
Saturday, January 14, 2006: 500-32
Saturday, January 21, 2006: 348-46
Saturday, January 28, 2006: 516-46
Saturday, February 4, 2006: 449-44
Saturday, February 11, 2006: 229-57
Saturday, February 18, 2006: 306-42
Saturday, February 25, 2006: 420-36
Saturday, March 04, 2006: 399-49
Saturday, March 11, 2006: 162-84
Saturday, March 18, 2006: 459-53
Saturday, March 25, 2006: 312-52
Saturday, April 01, 2006: 441-39
Saturday, April 08, 2006: 481-58
Saturday, April 15, 2006: 150-103
Saturday, April 22, 2006: 540-75
Saturday, April 29, 2006: 353-76
Saturday, May 6, 2006: 503-74
Saturday, May 13, 2006: 384-116
Saturday, May 20, 2006: 64-211
Saturday, May 27, 2006: 57-182
Saturday, June 3, 2006: 119-93
Saturday, June 10, 2006: 72-204
Saturday, June 17, 2006: 41-310
Saturday, June 24, 2006: 56-238
Saturday, July 01, 2006: 127-198
Saturday, July 08, 2006: 143-95
Saturday, July 15, 2006: 74-273 - This Week

As for new highs vs. new lows – here are the facts:
Monday showed a ratio of 102-147
Tuesday showed a ratio of 99-193
Wednesday showed a ratio of 90-185
Thursday showed a ratio of 43-386
Friday showed a ratio of 34-455

Piranha

Labels:

Friday, July 14, 2006

A Picture is Worth a Thousand Words


Need I say more?

‘Crisis Authors’ feed on people’s Fears!

I want to post about a subject that frequently appears in discussions online in recent years (especially over the past several months). It's about authors and their sheep followers that continue to predict these great depressions and crashes. I am not saying that it can't happen but their readers sure make them rich by reading most of their negative crap. What happened to the predictions from the books in the late 1970’s and early 1980’s? Read the book titles from the 1970’s and 1980’s and then read the book titles from today (listed below). Are you seeing a pattern? I didn’t go back to the 50’s or 60’s but I could find similar titles and then many more in the 1930’s. My point is: don’t believe everything you read and stop panicking by reading books from theorists (talkers, not doers). I must give credit to many of the books listed by Martin Schwartz and his book Pit Bull. I enjoyed reading it over my last vacation as it was very funny and educational (not a “how to” book).

Theorists make money selling books that sell fear while investors and entrepreneurs make money by following their ideas with money and hedging against a possible crisis. I learn from history and history shows us that these “crisis” books will always sell during tough times. Readers eat up this garbage because most people are trapped in the rat race working their asses off just trying to stay afloat. Their attitudes are typically piss-poor and they love to read about huge negative events (especially a crash that may hurt others).

Also notice how the same authors try to write books when the market starts to go back up again. For example, Howard J Ruff was writing about the crisis in 1979 through 1982 but then started to write about how to invest as a serious investor in 1987. Guess what: he was on the wrong end of the crisis in 1982 (the tail end) and the wrong end of the boom in 1987 (crash later that year). These “fools” are always late to the party and sell millions of books to the “average” person that engrosses themselves in fear!

These people, both now and then are not very accurate, they sell garbage in my opinion and I ignore it at all costs! I just hope many of you can do the same and make decisions based on what “YOU” see and not based on book sellers! Invest for now, ignore the garbage but be prepared for worst case scenarios by taking necessary steps but don’t radically change your life based upon the writings of a few authors that probably don’t invest themselves.

Books from the Past:
Crisis Investing: Opportunities and Profits in the Coming Great Depression by Douglas Casey (Hardcover - Jul 1980)

Crisis Investing for the Rest of the 90's by Douglas Casey (Hardcover - Oct 1993) - WOW was this wrong in 1993!

What the smart money is betting on in 1985: By Doug Casey by Douglas R Casey (Unknown Binding - Jan 1, 1985)

The Coming Currency Collapse and What You Can Do About It by Jerome F. Smith (Hardcover - Sep 1980)

Profits from silver by Jerome F Smith (Unknown Binding - 1983)

How you can profit from the coming devaluation by Harry Browne (Unknown Binding - 1970)

You can profit from a monetary crisis by Harry Browne (Unknown Binding - Jan 1, 1975)

How to Prosper During the Coming Bad Years - A Crash Course on Personal and Financial Survival by Howard J. Ruff (Mass Market Paperback - 1979)

How to Prosper in the Coming Bad Years by Howard J. Ruff (Mass Market Paperback - Jul 1981)

Making money: Winning the battle for middle-class financial success by Howard J Ruff (Paperback - 1986)

Howard Ruff's crash course for the serious investor by Howard J Ruff (Unknown Binding - Jan 1, 1987)

How to Prosper During the Coming Bad Years by Howard J. Ruff (Paperback - April 1984)


Books from Today:
The Coming Collapse of the Dollar and How to Profit from It : Make a Fortune by Investing in Gold and Other Hard Assets by James Turk and John Rubino (Hardcover - Dec 28, 2004)

The Coming Economic Collapse : How You Can Thrive When Oil Costs $200 a Barrel by Stephen Leeb and Glen Strathy (Hardcover - Feb 21, 2006)

Defying the Market: Profiting in the Turbulent Post-Technology Market Boom by Stephen Leeb and Donna Leeb (Hardcover - Jun 3, 1999)

Empire of Debt : The Rise of an Epic Financial Crisis (Hardcover) by William Bonner, Addison Wiggin (November 11, 2005)

The Great Bust Ahead: The Greatest Depression in American and UK History is Just Several Short Years Away. This is your Concise Reference Guide to Understanding Why and How Best to Survive It (Paperback) by Daniel A. Arnold (November 25, 2002)

Image courtesy of http://mirrorimageorigin.collegepublisher.com/media/paper144/stills/x5jf138r.jpg

Piranha

Thursday, July 13, 2006

Crude Breaking above Resistance

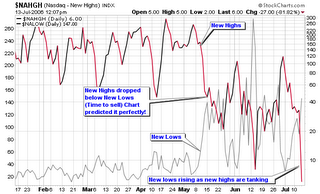
The NASDAQ is getting slammed below the recent up-trending support line as it trades below the June low (intraday action). If the NASDAQ closes below the June low, the attempted rally would be completely erased. Looking at the NH-NL ratio for the NASDAQ, we can see how new lows are rocketing higher as new highs are plummeting to almost nothing today. New lows use the number scale to the left of the chart while new highs use the number scale to the right of the chart.


Crude oil is also up over 2.5% as it broke above the resistance level of $75 a barrel. The daily chart highlights the break above the trading zone between $70 and $75. I told you to cover all “long” losing positions last night or positions that were turning against you with a slight gain. I will be very interested to see how the afternoon finishes and will update the day’s action on the daily screen tonight with all interactive charts telling the story in real time.


Piranha

Tuesday, July 11, 2006

Test Buys are starting to Pull-Back

Even though I have placed several test buys over the past few weeks, I am starting to see some of the breakouts pullback and possibly breakdown. I will not hesitate to cut these positions and move back to cash as this rally may be a false move especially since it confirmed well after the seventh day (original CANSLIM rules).

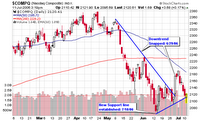
We’ve logged two consecutive negative days for the NH-NL ratio and are on target for a third today. Looking at the NASDAQ daily chart, we can see that the index has formed a new short term up-trending support line with today qualifying as the third touch. We slipped below the line intraday (briefly) but have managed to pull back above the line (slightly) in late afternoon trading.

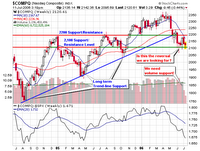
Looking at the NASDAQ weekly chart, we see that the longer term trend is holding support above 2,100 for the past seven weeks as a new range is starting to form between 2,100 and 2,200 (below both major moving averages). Relative strength for the NASDAQ has dipped to a new 52-week low as seen on the weekly chart.

The S&P 500 and DOW are trading near recent support levels but are struggling to climb above their respective 50-d moving averages. The S&P 500 is holding the 1,245 support level and is still above the up-trending support line dating back to 2004 but the short term outlook is not anything to write home about.

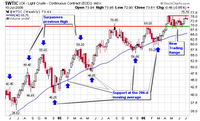
Finally, looking at crude oil, we can see that a 13-week trading range has developed between $70 and $76 with both numbers acting as support and resistance. I am still looking for a break below $70 in order for the market to gain a sustainable rally but it is not happening. Even if crude breaks the current trading range, I see the longer term moving average (40-week or 200-day) giving support lower as it has over the past several years.

We will need to continue to grind out small gains based on quick movements as the longer term trends are still sideways with volatile swings from month to month.

Piranha

Wednesday, July 05, 2006

Congratulations Italy!


Way to Go Italy!

-Especially after that dirty hit by the Frenchman! Way to lead by example captain!