Market Talk with Piranha is currently moving to its new home at chrisperruna.com. The new site is up and running but many of the posts need editing as the images and stock charts did not transfer successfully (thanks blogger). I will post all new entries to both blogs – Thank you for your patience while I make this change!

Wednesday, May 31, 2006

Blogging to the World Series of Poker


As many of you know, I love the market, I love writing and I love poker. In addition to writing on this blog, I write market analysis and provide equity research five times a week on MSW. To my delight, I went to play a sit-and-go no limit hold’em game tonight and saw an advertisement link to a free tournament sponsored by PokerStars for all types of bloggers. I use PokerStars.com exclusively and can recommend them to anyone interesting in playing online.

Here are some details from the PokerStars website:

PokerStars is proud to announce the 2nd Annual World Blogger Championship of Online Poker (WBCOOP). This is an exclusive FREE poker tournament open ONLY to Internet bloggers.”

“To prove our continued commitment to the bloggers of the world, we're giving away a $12,000 package to the 2006 World Series of Poker. This package includes a $10,000 buy-in to the main event, hotel accommodations, and additional spending money. Imagine blogging your WSOP experience live from Las Vegas! You'll have endless blogging material, a shot at being on TV, and a chance to win millions of dollars.”

“…you do not need to deposit money in your PokerStars account or provide any financial information in order to play in the World Blogger Championship of Online Poker event. Yes, it's absolutely free!”

Each blogger in the poker tournament will start with 2,000 chips.
Blinds will start at 10/20 and will go up every 15 minutes.
Prizes will be awarded based on placement in the tournament.

Good Luck to all that enter!

I will be there using my wife’s screen name for good luck!

Piranha

Online Poker

I have registered to play in the PokerStars World Blogger Championship of Online Poker!

This Online Poker Tournament is a No Limit Texas Holdem event exclusive to Bloggers.

Registration code: 9433662

Tuesday, May 30, 2006

Hedge Funds - Richest of the Rich

It’s good to be back from vacation and refreshed after following the weak market over the month of May. As I was away, The New York Times was delivered to my door each morning (complimentary) and I found an interesting article. I have always been amazed by the enormous incomes that hedge fund managers produce year in and year out. I have even posted up the top 10 salaries from past years (example: 
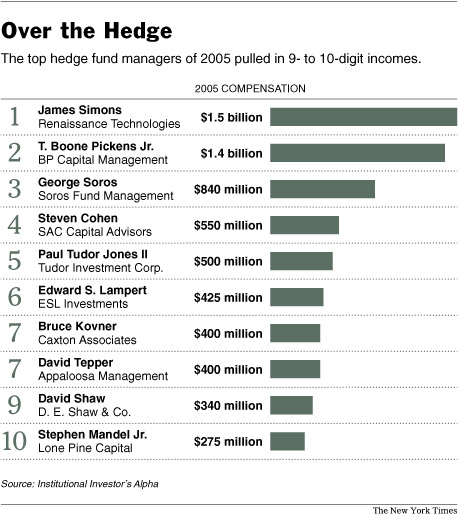
Top Incomes in 2003 for Hedge Fund Managers ). If you briefly view the top 10 from 2003, you can see that George Soros was #1 with a take home pay of $750 million. Well, only two years later the top earner has doubled the total from 2003 to a whopping $1.5 billion (eclipsing last year’s top earner by $500 million). Edward Lampert was the first manager to surpass the billion dollar mark in 2004 but two men accomplished the feat last year. One of my favorite traders, Steven A. Cohen remained in the top 10 with a salary of $550 million. Mr. Cohen, along with several others on the list below has been featured in the book series titled: Market Wizards (all highly recommended). Below is the entire article from The New York Times written by Jenny Anderson (originally printed on May 26, 2006):

Enjoy, the numbers are staggering!


Atop Hedge Funds, Richest of the Rich Get Even More So
By JENNY ANDERSON

Published: May 26, 2006
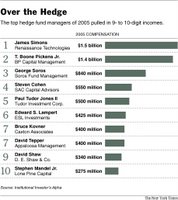
*image from The New York Times website*

Talk about minting money. In 2001 and 2002, hedge fund managers had to make $30 million to gain entry to a survey of the best paid in hedge funds that is closely followed by people in the business. In 2004, the threshold had soared to $100 million.

Last year, managers had to take home — yes, take home — $130 million to make it into the ranks of the top 25. And there was a tie for 25th place, so there were actually 26 hedge fund managers who made $130 million or more.

Just when it seems as if things cannot get any better for the titans of investing, they get better — a lot better.

James Simons, a math whiz who founded Renaissance Technologies, made $1.5 billion in 2005, according to the survey by Alpha, a magazine published by Institutional Investor. That trumps the more than $1 billion that Edward S. Lampert, known for last year's acquisition of Sears, Roebuck, took home in 2004. (Don't fret for Mr. Lampert; he earned $425 million in 2005.) Mr. Simons's $5.3 billion flagship Medallion fund returned 29.5 percent, net of fees.

No. 2 on Alpha's list is T. Boone Pickens Jr., 78, the oilman who gained attention in the 1980's going after Gulf Oil, among other companies. He earned $1.4 billion in 2005, largely from startling returns on his two energy-focused hedge funds: 650 percent on the BP Capital Commodity Fund and 89 percent on the BP Capital Energy Equity Fund.

A representative for Mr. Simons declined to comment. Calls to Mr. Pickens's company were not returned.

The magic behind the money is the compensation structure of a hedge fund. Hedge funds, lightly regulated private investment pools for institutions and wealthy individuals, typically charge investors 2 percent of the money under management and a performance fee that generally starts at 20 percent of gains.

The stars often make a lot more than this "2 and 20" compensation setup. According to Alpha's list, Mr. Simons charges a 5 percent management fee and takes 44 percent of gains; Steven A. Cohen, of SAC Capital Advisors, charges a management fee of 1 to 3 percent and 44 percent of gains; and Paul Tudor Jones II, whose Tudor Investment Corporation has never had a down year since its founding in 1980, charges 4 percent of assets under management and a 23 percent fee.

They may charge such amounts because they can. "In the end, what people want is the risk-adjusted performance," said Gordon C. Haave, director of the investing and consulting group at Asset Services Company, a $4 billion institutional advisory business. "As long as the performance is up there, in the end the investors do not care about the high fees."

If there is a downside to being so rich, it is that the money is flooding in at a time when hedge fund performance, even for some of the greats, has been less than stellar over all. Six managers made the top 25 even while posting returns in the single digits.

"You would think someone would be a little embarrassed taking all that money for humdrum returns," said John C. Bogle, founder of the Vanguard Group. "I guess people don't get embarrassed when it comes to money."

Many of the funds have gotten so big that the management fees alone are the source of much wealth, perhaps leaving some managers without the fire to try to outdo the broad market. Institutions like pension funds and endowments, whose money is fueling a significant part of the hedge fund boom, continue to flock to these managers for their track records and name recognition.

Bruce Kovner's Caxton Global Offshore fund returned 8 percent last year while his Gamut Investments, an offshore fund he runs for GAM Fund Management, returned 6.4 percent. The survey said 2005 was the third year that he had posted single-digit returns. Still, Mr. Kovner took home $400 million, according to the list. He did not return calls to his office.

The average take-home pay for the 26 managers in 2005 was $363 million, a 45 percent increase over the top 25 the previous year. Median earnings surged by a third, to $205 million last year, from $153 million in 2004.

Included on the list were both familiar names and new stars. Mr. Cohen of SAC Capital, who while shunning publicity has become known as an avid art collector, landed in fourth place in 2005, taking home $550 million. For the year, his various funds were up 18 percent on average. A spokesman for Mr. Cohen declined to comment.

New to the list are two managers from Atticus Capital, a fund that was among the investor activists that opposed Deutsche Börse's attempted takeover of the London Stock Exchange for $2.5 billion. That campaign led to the ouster last year of the Deutsche Börse chief executive. Atticus is also a major participant in the battle for Euronext, the pan-European stock and derivatives exchange, which is being courted by the New York Stock Exchange and by Deutsche Börse.

Making his debut at 14th place, Timothy Barakett made $200 million in 2005. His Atticus Global Fund was up 22 percent net of fees, while the European Fund, managed by 33-year old David Slager (No. 20 on the list with $150 million), soared 62 percent. Atticus officials did not respond to requests for comment.

A fellow investor activist, Daniel Loeb of Third Point, made $150 million in 2005. According to Alpha, only 10 percent of the firm's $3.8 billion is dedicated to activism, an unexpectedly small slice considering his reputation as management's worst nightmare.

A value- and event-driven manager, Mr. Loeb posted returns of 18 percent, largely from bets in energy, including a 140 percent gain on McDermott International. Mr. Loeb's spokesman declined to comment.

Another debut on the list was by William F. Browder, founder and chief of Hermitage Capital Management and the largest foreign investor in the Russian stock market. He tied for 25th place by taking home $130 million.

Mr. Browder, 42, grandson of Earl Browder, onetime leader of the Communist Party of the United States, has been barred from returning to post-Communist Russia since November, when immigration officials revoked his visa. The fund had $4.3 billion under management and in 2005, his flagship Hermitage Fund was up 81.5 percent.

A shareholder activist, he has challenged management at Russian state giants including Gazprom and Lukoil. Mr. Browder could not be reached for comment.

Wednesday, May 24, 2006

The Fear of Losing Money

I thought is would be interesting to sit down and write about people’s fear of money. Many investors fail in our world due to their fear of losing money. I don’t want to confuse the concept of protecting one’s money through proper money management and the “actual” fear of going broke. These fearful investors base their entire system and style of investing on a negative thought process. Successful investors, whether it be in stocks, real estate, businesses, etc. always think about strategies to protect from the down-side but they focus on the reward versus the original risk. Unsuccessful investors think about losing the initial investment and more often than not, pass up on a potential golden opportunity.

How many times have you heard a person say: ‘if I only put my money into that stock or that piece of real estate”? These same people are also the ones that continue to pass up on potential opportunities today because they are scared to lose. Nothing comes easy and life rarely serves up a free pass without some form of risk attached. When speaking in terms of stocks, an investor must place money after their best ideas or they will never know if they have a winning system. Many people paper trade and claim they can pick winners but I view them as fearful of losing money. The fear of money and the fear of losing are two of the main reasons why so many people go broke on Wall Street. If you don’t fear money and can accept losing as part of the game, you will eventually become successful.

A perfect example of a type of person that fears to lose money is a scared poker player. Sit at any $1-$2 no-limit hold’em game at a casino and you will quickly realize who fears money and who plays without fear. Good players may continually lose because they fear the dollar and fail to play according to their strategy. I have seen several bad players win lots of money at the tables because they bully the scared players out of their hands. The players without fear may be garbage players but they dominate and get lucky because they have a huge advantage against a fearful player that probably has the odds on their side. For example: if you are dealt a KK and raise for the first time but one of these fearless players re-raises all-in to scare you out of the pot, would you fold. I have heard many stories of players folding high quality hands due to their fear of getting a bad beat. In this case, the bully can only represent one hand that can beat yours, so the odds are heavily in your favor so you must call and call quickly (don’t have fear when the odds say you should win). Two remedies exist for the fear of a bad loss: a bankroll that can withstand a few bad beats and a strategy that capitalizes on hands with high odds for potential winners. Over the long term, you will be a consistent winner but must understand that beats will happen and some of them will be large (if it is a bad beat). Assuming that you let go or cut poor hands short, these larger losses can be avoided consistently. In poker and in life: scared money is dead money!

The same holds true in investing and in life. The people that assume the risk and calculate the odds of success are typically the ones that come out ahead with larger bank accounts. They don’t focus on the losing aspect of a deal and never blurt out the words “what-if”. To repeat, they don’t ignore possible failures as they prepare for the worst and expect the best. I will not deny that I have been in situations where I was scared to lose but that helped me seek out the answers to consistent winning. Losing will always sting a little bit in my case as it is part of my nature (a long background in sports) but I now accept losing as part of the game. I am NY Mets fan and grew up in a city that loves the Yankees and I always wanted the Mets to win (every game). Now that I am older, I understand that winning a series is more important that looking to win every game or sweep every series. If a team aims to win each series, they will most likely end up in first place when the season closes. A team that is about to play a 10 game road trip should aim to win six games and lose no more than 5. No one should sit there and expect them to win all 10 games. I expect each player to have the mindset to win the game on each specific day they wake-up but they can’t expect to win every game of the season.

I do the same with each trade I put on – I expect to win each trade but ultimately understand that some will fail and it’s ok as long as I don’t let it become catastrophic. I have learned to accept losing trades, losing money and I have challenged the fear of money. I place risk under control by developing and using a positive expectancy system and money management techniques that eliminate my fear of losing money. I may lose many small battles but I depend on my system to win the ultimate war.

Here is a quote from the movie Rounders:
“In "Confessions of a Winning Poker Player," Jack King said, "Few players recall big pots they have won, strange as it seems, but every player can remember with remarkable accuracy the outstanding tough beats of his career." It seems true to me, cause walking in here, I can hardly remember how I built my bankroll, but I can't stop thinking about the way I lost it.”

That quote can be tied to investing with great accuracy.

One more quote that fits with the article I have written about the fear of losing money:
“They're trying to goad me, trying to own me. But this isn't a gunfight. It's not about pride or ego. It's only about money. I can leave now, even with Grama and KGB... and halfway to paying Petrovsky back. That's the safe play. I told Worm you can't lose what you don't put in the middle. But you can't win much either.”

*picture provided from actionforex.com*

Piranha

Monday, May 22, 2006

Dooms-day? Is this really 1987 all over Again?

With the markets heading lower once again, I am sitting here with a big grin on my face as I start to pack for vacation. Why am I grinning? I have been scaling out of the markets over the past several weeks and have been advising all MSW members to do the same. My indicators have been turning very weak and the NH-NL ratio has been predicting this type of collapse all year long. As the markets neared multi-year highs and all-time highs, the NH-NL ratio stayed weak; a clear sign that we were watching a false move. I don’t expect to see a magazine cover similar to the Time image I uploaded any time soon but I may be wrong(from November 1987).

I highlighted some key quotes of mine on this blog from the MSW screens in May which show you how serious I thought this decline could become. It is a coincidence that I am leaving for vacation and the markets are so weak but it works perfectly for capital preservation. I am not worried about a thing because I have moved to sidelines and will enjoy time in the sun with my family as some people continue to average down and pull their hair out (trying to predict bottoms).

Now I will post up a “dooms-day” article that was featured on The Drudge Reportand has now been uploaded to many blogs and financial sites around the web. It is an interesting article from the London Times. A simple look anywhere online or in print will show you how investors are panicking. Gloomy articles are being written by the minute. Enjoy!


The Sunday Times May 21, 2006

Markets ‘are like 1987 crash’
David Smith, Economics Editor

CONDITIONS in the financial markets are eerily similar to those that precipitated the “Black Monday” stock market crash of October 1987, according to leading City analysts.
A report by Barclays Capital says the run-up to the 1987 crash was characterized by a widening US current-account deficit, weak dollar, fears of rising inflation, a fading boom in American house prices, and the appointment of a new chairman of the Federal Reserve Board.

All have been happening in recent months, with market nerves on edge last week over fears of higher inflation and a tumbling dollar, and the perception of mixed messages on interest rates from Ben Bernanke, the new Fed chairman.

“We are very uncomfortable about predicting financial crises, but we cannot help but see a certain similarity between the current economic and market conditions and the environment that led to the stock-market crash of October 1987,” said David Woo, head of global foreign-exchange strategy at Barclays Capital.

Apart from the similarities in economic conditions, during the run-up to the 1987 crash there was a sharp rise in share prices worldwide and weakness in bond markets, Woo pointed out. “Market patterns leading to the crash of 1987 resemble the markets today,” he said.

Equity markets settled on Friday after sharp mid-week falls, with all the main American stock-market measures recording small gains on the day. But nerves remain.

Gerard Lyons, head of research at Standard Chartered, said: “The volatility is explained by tighter liquidity conditions, markets pricing in more for risk and dollar vulnerability. But people forget that this is not a case of emerging-market economies being in trouble as in 1997-8. They’re in good shape.”

The vulnerability of stock markets is likely to add to the case for a prolonged pause before the Bank of England hikes interest rates, analysts believe.

While one member of its monetary policy committee (MPC) voted for a rate hike earlier this month, some recent data, notably subdued labour market conditions, suggest few signs of inflationary pressure.
Base rate is unlikely to rise until next year, according to a survey of analysts by Ideaglobal.com, a financial-research consultancy. It finds a median expectation that the rate, currently 4.5%, will rise in February next year.

Piranha

Friday, May 19, 2006

Commission Fees water down Expectancy

I have talked about position sizing and I have talked about expectancy.
If you understand the proper positing sizing algorithms and positive expectancy, you would think that you are on the road to riches or at least to a system that returns a profit. Not so fast! What happens when commissions start to eat away at the profits you thought you would have at the end of the year? Many investors have a winning system with a positive expectancy but that might not be profitable in the end when adding in the heavy toll of commissions.

As I have stated in previous posts, expectancy will tell you if your system will be profitable over time but you must use a position sizing calculation in order to trade the proper amount or you could be broke before you know it. Trading too large will send you to the poor house on your first or second major mistake. You don’t want to dig yourself into a hole you can’t climb out of with a positive expectancy system. It would be a sin to have developed a positive expectancy system, only to be ruined by commissions.

I am not a day trader although I continue to see advantages each and every day as I learn more about many of the advanced techniques of professional investing. Under my current system of investing (call it trend trading, momentum trading or swing trading), I pay a commission of $9.95 on each end of the trade (I rarely use limits but they cost a few dollars more on each end). That is cheap in my estimation but the more I increase my activity, the higher my costs become and the lower my expectancy becomes when adding in this major factor. Besides, I don’t have the advantage of using 4-to-1 margin the same way a day trader can leverage their account and position sizing algorithm. Day traders typically pay commissions per share rather than paying on each end of a “total trade”. From what I understand, this breaks down to a much cheaper structure as long as minimum trading levels are reached. If these levels are not reached, penalties may be applied but check with your own broker before you take my word for it.

I typically place the entire trade when I get a signal and use retracement stops to get out of a position to capture gains so I am only required to pay commissions once on each end. In tough markets, I will place tester buys but I also understand that my commission fees will accumulate due to the fact that I scale into the position and sometimes scale out. If I only place 1/3 of my anticipated position on the breakout in a weak market, my $20 round trip commission could accumulated to $40, $60 or $80+ based on the number of scale-ins or scale-outs I use. Using my current style of momentum trading, I can handle these larger commissions because I am aiming to capture larger gains per trade than most day traders. I am looking for the 25% initial breakout gain that accompanies many CANSLIM type stocks. Looking forward, I am developing systems that trade more frequently so I can realize my calculated expectancy over a specific number of trades. Since my number of trades will increase and my individual profits per trade will decrease, I want to minimize my commission fees.

It is very important to factor in commissions when calculating your overall expectancy. If your expectancy is positive but only slightly, be wary that higher commissions may push this number into negative territory. Weigh all factors before implementing a system that looks good on paper but actually comes out negative and gives you no chance of winning over the long term. A negative expectancy system (including commissions) will make you go broke if you continue to trade it. Think of that casino analogy; gamblers will go broke playing the tables in Vegas because the odds are against them. They may make a few big scores but in the end, the casinos take it all! Trade a negative expectancy system and the markets will take it all!

I love the movie Casino and there is a scene in this movie when Robert Di Niro develops a plan to keep a high stakes gambler at the casino so he can continue playing (to give back the money he won by luck – he made a big score). Di Niro (the casino manager in this movie) knows that the shark will lose if he continues to play because math never lies and the game of baccarat has a negative expectancy geared towards the players. Again, this is why I play poker at the casinos (they get a rake but that is just a commission fee in my mind as the positive expectancy is based on me playing the odds)!

Piranha

Thursday, May 18, 2006

Did the NASDAQ surprise you?

I wanted to share with everyone the analysis I posted up to MSW screens last night because it makes a firm point that some just don't get! Some investors continue to be surprised - can't help everyone!

MSW mid-week analysis (5/17/06 9:00pm):
I am extremely happy over the e-mails I received today, commenting on the expectancy post, from both MSW members and non-members. It means a great deal to see that so many people “get-it” and how a simple spreadsheet helps so many more get that “ah-ha” feeling. I am going to follow up that post with an answer to another question on expectancy tomorrow. I will continue to feed you these advanced strategies in stages so you can digest what I trying to convey.

Now, I don’t want anyone to write me an e-mail asking “what to buy” or “why is the market going lower”. Hey, if this is harsh, so-be-it because I can’t spell out the dangers in the market any more clearly than I have over the past two weeks. I have been uploading a red bold text warning that “NOW IS NOT THE TIME TO BUY” with the first portion reminding you about the ‘M’ in CANSLIM. I even provided a link to my article from last year on the ‘M’ in CANSLIM. If you buy in this environment, be prepared for days like today and be prepared to take heavy losses. When I slash the MSW Index down to 14 stocks, it’s for a very good reason: the market is WEAK! It amazes me that some people don’t “get-it” and must be invested at all times trying to pinpoint the bottom while searching for opportunities on the long side.

When my daily and weekly screens go blank or get slim in size, it is the best indicator to me that it is time to ease off margin, move to cash and entertain the idea of going short. When speaking about going short, you should start to analyze sectors or industry groups that are in late stage bases or contain stocks that are violating moving averages and support lines (simultaneously). To confirm the screens, the NH-NL ratio has tuned negative (the number one reason to stop placing long positions). I said this just last night after a period of strength among some of the recent leaders:

5/16/06:
“Even with the strength of our leaders today, I am still playing heavy defense due to the negative reading for the NH-NL ratio for the second day this week: 99-138 (74-241 yesterday).”

5/15/06 & 5/16/06:
“Tonight’s daily Screen is a pure Watch List looking for potential buy candidates in the future. The market health is weak so sit tight and brush up on your trading skills, system development and money management techniques.”

5/13/06:
“We have now witnessed six distribution days for the NASDAQ and four for the S&P 500 over the past month (clear signs of institutional selling).”

5/13/06:
“Both the NASDAQ and S&P 500 have violated their 50-d moving averages as the NASDAQ fell over 4% to close slightly higher than its 200-d m.a. The Index has closed at its lowest level since the turn of the New Year. If it violates its 200-d m.a., I see it traveling down to the long term trend-line that started in the summer (July) of 2004.”

5/17/06:
The NASDAQ is now trading below the 200-d m.a. and is sitting on the long term support line that dates back to 2004. Violating this trend line will be a major red flag.

5/13/06:
“Unless you are a day trader, I advise that you take some time away from the markets and regroup. I am going on a mini-trip over Memorial Day weekend and I suggest that everyone else take some time to enjoy other things or at least take a small break from trading (especially since our market environment has turned negative).”

5/13/06:
“The MSW Index is now going through some of the most dramatic changes in over a year. If you want me to post “buy candidates” then you don’t understand how the markets work. I am sorry but now is not the time to be buying (in my opinion) based on all of my indicators.”

5/13/06:
“The leaders are getting crushed and the NH-NL ratio is declining with a negative day on Friday.”

5/10/06:
“As we start to hit this stretch, follow the rules and never break a stop loss (it might even be time to take a break and enjoy the sun)!”

To top off all of these quotes, I wrote an extensive analysis last Saturday documenting the six month period between May and October (focusing on the weaker summer months since 1950). I showed you how stocks start to take breathers and decline during the months of May and June.

The DOW came within 80 points of its all-time high last week but we are traveling different waters this week as the index is now trading below the 50-d m.a. for the first time since late January and early February. Today’s 214.28 drop on the DOW was the largest percentage drop since May 2003 (that month of May again). The index was down 1.9% on volume 22.9% larger than yesterday (clear signs of heavy distribution). Want me to sound crass? I was not hurt by the drops in the market over the past five days of trading and I am extremely proud. I use the arrogance to help get the message into everyone’s head!

The NASDAQ is now showing a 0.4% loss for 2006 and is 7.6% from its 52-week high. The NASDAQ 100 is now 3% below the 200-d m.a. as 191 of the 197 industries tracked by IBD closed lower today (many on increased volume). The seven distribution days over the past four weeks should be sounding alarms to protect your capital. The NH-NL ratio closed at 56-250 today, continuing the streak of negative ratios.

REMEMBER THE ‘M’ IN CANSLIM! NOW IS NOT THE TIME TO BUY!!!
The ‘M’ in CANSLIM:

Take a look at the Industries that fell the most today (do they have something in common):

Copper
Aluminum
Steel & Iron
Gold
Oil & Gas Drilling & Exploration
Industrial Metals

*No new stocks will be screened tonight for good reason – I hope you get the point*

Piranha

Tuesday, May 16, 2006

What is Expectancy?

To Start: Here is the link to the Expectancy Calculator in Excel
Feel free to save it to your computer!

Use the expectancy calculator with my Position Sizing Calculator

I have been watching as a several people on a forum discuss, argue and lend their ideas about entry techniques. They are going crazy over what the proper entry should be and why one chart pattern is better than the other. One person has even said how they purchased massive amounts of software to help them enter the market. Now don’t get me wrong, I always use techniques to get me in the market but I understand that this is the least important factor weighing on an investor’s overall success. I use technical analysis every day and I study patterns that allow me to enter with the ideal buy point (what I believe to be the ideal entry) but I know that strong up-trending stocks give me just as good a chance to make money as stocks breaking out of a cup with handle pattern. I am one that makes my living buying stocks making new highs so I can basically prove that the random entry strategy does work as long as strong money management and exit strategies exists.

By reviewing my personal trades and the coverage of dozens of stocks on the MSW Index over the past two years, I can tell you that my system with the highest expectancy is buying fundamentally sound stocks that are making new highs on above average volume. Where do I find these fundamentally sound stocks? I use multiple computerized screeners that filter out stocks with increasing earnings, high EPS ratings and increasing relative strength ratings. Once I find these stocks, I narrow them down using my own eyes by performing technical analysis. The process is simple as I am basically looking for stocks making new highs with decent to strong fundamental numbers. The process is almost random. To tell you the truth, I could probably narrow down my buy candidates each week to a list of 20 and throw darts at ten stocks to buy the following week and still have a profitable year because I do use position sizing and strict sell rules. Think I am crazy: think again as I explain what expectancy is.

I responded on the forum by saying: Entering at the right time is important and it can lower your risk and increase your overall expectancy but money management and exits are much more important than entry.

Studies have been done between random entry systems and specific systems that use entries based off of chart patterns with amazing results. The random entry system typically outperforms the structured entry system when it uses money management (position sizing techniques) and a strong exit strategy (assuming that the structured system doesn’t employ money management tools).

I love CANSLIM and O’Neil but the entry is not the most important aspect you should be focusing on, it is money management and exits. Most people don’t want to hear this and that is why so many “entry based systems” sell so well over the years. How many of those systems actually make their users money? CANSLIM does use a 7%-10% sell stop rule but it ignores position sizing and never explains the probabilities of the system when implemented in certain ways.

As I said, I make money using a system based from CANSLIM (an entry system) but it is heavily balanced with strong money management techniques and a strong exit strategy.

So what is expectancy?

Expectancy tells you what you can expect to make (win or lose) for every dollar risked. Casinos make money because the expectancy of every one of their games is in their favor. Play long enough and you are expected to lose and they are expected to win because the “odds” are in their favor. Most games at a casino are completed in a short period of time so they can increase their odds of winning. The same holds true for investing. If your expectancy is positive; you can make more money with multiple trades in shorter periods of time. If you told me this ten years ago, I would strongly disagree based solely on beliefs. Now with experience, I continue to move down the path to more frequent trading and a structured system that is run like a business. I now have massive amounts of data based on real trading that I have performed over the past several years.

Expectancy is your profit percentage per win multiplied by your win rate minus your loss percentage per loss multiplied by your loss rate. I will use examples from Trader Mike’s: Trading 101: Expectancy and Van Tharp's Book: Trade your way to Financial Freedom:

Expectancy = (Probability of Win * Average Win) - (Probability of Loss * Average Loss)

Expectancy = (PW*AW) less (PL*AL)
PW is the probability of winning and PL is the probability of losing.
AW is the average gain (win) and AL is the average loss

So let’s do an example (assume $12,500 per position, a $100,000 portfolio using 1% equity risk):
If my trades are successful 40% of the time and I realize an average profit of 20% but I lose an average of 5%, my expectancy is $625 per trade.

(0.4 * $3,125) - (0.6 * $625) = $625

$1,250-$375 = $625

I lose 60% of the time yet I show a profit of $625 per trade. If I have a system that produces 65 trades per year, I would realize an annual gain of $40,625 (hypothetical scenario). A 40% gain on the original $100,000 (minus all commissions, fees, taxes and compounding).

Trader Mike offers an example geared towards a day trader:
"As an example let's say that a trader has a system that produces winning trades 30% of the time. That trader's average winning trade nets 10% while losing trades lose 3%. So if he were trading $10,000 positions his expectancy would be:
(0.3 * $1,000) - (0.7 * $300) = $90

So even though that system produces losing trades 70% of the time the expectancy is still positive and thus the trader can make money over time. You can also see how you could have a system that produces winning trades the majority of the time but would have a negative expectancy if the average loss was larger than the average win:
(0.6 * $400) - (0.4 * $650) = -$20

In fact, you could come up with any number of scenarios that would give you a positive, or negative, expectancy. The interesting thing is that most of us would feel better with a system that produced more winning trades than losers. The vast majority of people would have a lot of trouble with the first system above because of our natural tendency to want to be right all of the time. Yet we can see just by those two examples that the percentage of winning trades is not the most important factor in building a system. " - Trader Mike

Most traders look for three major factors when developing a system:
The right odds or positive expectancy
Multiple trades (opportunity)
Shorter holding periods to compound the profits

Let’s look at the calculation one more time using only percentages:
PW: 48%
AW: 10%
PL: 52%
AL: 4%

(48% * 10%) - (52% * 4%) = 2.72%

Using a trade size of $12,500, each trade would return you $340 or 2.72% (profit). Let’s say this system gives you 200 trades per year; your result would be a $68,000 profit with only 1% of equity risked or $12,500 on $100,000. This doesn’t include compounding profits with each successful trade.

A positive expectancy can come from an unlimited amount of numbers or scenarios. You could have a system that produces winners 30%, 50% or 80% of the time and each system could be positive or negative based on PW, AW, PL & AL. An infinite number of trading systems and/or number combinations can be used to find a positive expectancy system.

The one thing I have realized over the past few years as my account grows is the fact that opportunity must exist to make money with a positive expectancy system. Think of the casino; the more you play, they more they win. The same is true for trading; the more you play with a positive expectancy system, the more your odds are for that system to return the expected number.

I have been tailoring my system to produce more trades and opportunity so I can take full advantage of the mathematical odds. As many of you know, I graduated as an architectural engineer and love numbers since my courses were based in advanced math and physics. Numbers don’t lie; I love to play poker because I understand the odds so I am typically successful over long stretches of time at the table because I have the emotional stability to only jam the pot when the odds are in my favor. Like stocks, I do my best to let go of losing hands and losing positions (sometimes I follow a committed hand in poker or a committed position with stocks but the odds are no longer in my favor and more times than not, I lose the hand or settle for my maximum stop). I am attracted to games with numbers and odds and the stock market is the best game in the world (in my opinion). Poker is a close second.

I want you to think about one more example (provided from ARB Trading)

"You will be more profitable with $100,000 that you could "turn" 250 times per year, than $500,000 that was tied up in one trade for 12 months. As an example, let's say we have one trade and that trade yielded a 50% return. You just had a great year - a $250,000 profit.

On the other hand, say you had $100,000 for stock purchases, and your expectancy was only 1.2% per trade but you turned over your stocks 250 times in the same year. This method ends up generating $300,000 for the year, and that assumes you never increase the position size as the equity grows. You just had a better year. And it is easier to get 1.2% per trade than 50%." - ARB Trading

Piranha

Wednesday, May 10, 2006

New Highs Everywhere?

Investors sit patiently or anxiously in some cases ahead of the Federal Reserve’s next move on interest rates, to be announced today. The DOW is within striking distance of its all-time high of 11,722.98, reached on January 14, 2000. Crude oil is sitting slightly above $70 (near major support – also known as the prior resistance line). Gold is trading slightly above $700 an ounce, its highest level since 1980. With the stock market, crude oil, gold (and other commodities) all trading at or near highs, we know one of these areas must bust or give way to the others. I don’t have a crystal ball so I can’t tell you which area will fall first or the hardest but I have plans to protect my capital against any major decline or collapse. Take a look at the 10-year chart of the DOW and see how close we are to making a new all-time high. I am waiting for the Fed announcement later in the day to see how I will continue to play positions going forward.


Piranha

Tuesday, May 09, 2006

This “Buds” for HANS

Hansen Natural (HANS) was up over 16% today to close above $176 (an all-time high) after solid earnings and an announcement stating that the company will form a distribution agreement with Anheuser-Busch. I have written about the stock several dozens times on the MSW screens and at least a dozen times on this blog in 2006. I have personally owned the stock on two separate occasions (buying at levels that some investors thought were crazy – too high or extended). I took my first position above $66 in May 2005, even though the stock was up several hundred percent during the prior year. I sold the stock later that summer for a 50% gain due to my objective being hit (looking for a $60-$100 run).

I continued to follow the stock and watched as it built a base after a stock split. As soon as HANS broke out of the sideways consolidation, I jumped back in last November. I held the stock once again with the exact objective as I had the first time: another $60-$100 run. I was awarded with another 50%+ gain as the stock completed its second $60-$100 run in one year. After selling the stock due to another consolidation near $100, I removed it from the MSW index shortly thereafter.

I continued to cover the stock on an honorable mention list and wrote about it several times on this blog over the past two to three months. Looking back, I see that I sold too early but my objective was met so I can’t be greedy. Maybe I should have looked for a third entry into the stock as it is now worth $175 per share or $360 (pre-split adjusted from my original purchase last May). I left $75 on the table and another 75% if I bought back in above $100. If I held the stock without jumping in and out, I would now have a long term capital gain of 430%. It’s all hindsight now but the main point of this post is the fact that great stocks and highly priced stocks can go higher. HANS is now up over 1,800% since its initial breakout in May 2004. You read that right: 1,800% in two years. I managed to grab a compounded gain of slightly more than 100% and I am very happy but I think of what could have been! As soon as that thought creeps into my mind, I trash it because it’s an emotion detrimental to my overall plan.

Below is the actual analysis I gave when I added the stock to the MSW Index on May 7, 2005 and then again on November 11, 2005. HANS lived on the MSW Index for about 20 weeks and has been the number one stock on my honorable mention list for the past two months. HANS is a superstar in my eyes and I am extremely proud that I was part of its stock market history.

11/5/05:
HANS – 57.63
, With the breakout from the sideways movement over the past several months, HANS is back on the weekly screens with an up-trend that is still intact going back several years using the 200-d m.a. as support – AMAZING chart.

Hansen Natural (HANS) is back on the MSW weekly screens for the first time since August 6, 2005. The stock debuted the first time at a pre-split adjusted $66.56 and lasted for 13 consecutive weeks until its final screen at $91.46 on August 6, 2005. The stock reached a weekly high of $97 while on the MSW screens and basically completed a $60-$100 run. Since August, the stock split and has been correcting in a sideways pattern. The breakout this week made us take notice on a daily screen and after further analysis, we felt is was a good idea to bring back to the weekly screens. I will be very interested to see if the stock can make another $60-$100 run, that would be a remarkable feat to accomplish two times in one calendar year.


5/7/05:
HANS – 33.28
, (pre-split adjusted $66.56), we profiled the stock on the case study this week with major support down near $53. The stock boasts one of the strongest RS lines in 2004 and 2005.


I leave you with one question: Is HANS priced high or low in your opinion? Many thought is was overpriced and done last May at $66 (split adjusted $33).

Piranha

Friday, May 05, 2006

The Right Bet was with Las Vegas

Two MSW Index stocks have reported since the close of the market yesterday and we are batting .500 (one right and one wrong but I can say that we could have anticipated the one that went wrong).

Las Vegas Sands (LVS), $71.34, was up over 7% in early afternoon trading as first-quarter earnings jumped to $121.8 million, or 34 cents per share, from $7.1 million, or 2 cents per share, in the prior-year period. The year-ago results were significantly impacted by an $86.3 million loss on the early retirement of debt. Adjusted net income rose to $134.8 million, or 38 cents per share, compared to $103.1 million, or 29 cents per share, during the same period last year. LVS has now gained 26% on the MSW Index since April 1, 2006 – another successful trade.

Here is what I had to say on last Saturday’s MSW Index:
4/29/06
LVS – 64.81
, Earnings come out this Thursday so be ready for that up or down swing. If numbers keep in-line with past reports, I expect the stock to beat expectations and move higher (a hard stop is advisable to protect from bad news).

This is what I wrote when the stock was added to the Index last month:
4/1/06
LVS – 56.66
, The stock has been screened many times (daily) over the past several weeks so I have decided to add it after further research. The stock comes to the Index as a possible $60-$100 candidate over the next twelve months. The strong 8% move this past week gives us the feeling that the young stock is ready to move. I am also looking at the September call options (in the money calls).

By the way, these in-the-money calls were trading at $7 last month (they are trading above $17 today). A $700 contract would be trading at $1,700 in one month, a 143% gain.

LoJack (LOJN) shares are down over 11% in mid afternoon trading as the maker of vehicle-tracking devices posted an 11 percent jump in first-quarter profit, but the company's shares are down due to concerns the company is lowering prices too aggressively. The drop should not come as a surprise to MSW members as we highlighted trouble in the chart on last Saturday’s weekly screen:

4/29/06
LOJN – 22.11
, The stock is in trouble. This is one of the first 200-d m.a. plays that have violated the long term support line without making that anticipated “pop”. Volume is low so we will keep it here until May 5 – earnings day. Place a hard stop to protect against bad news. If good news hits the wire, the stock will fly! Rating: Hold

We added the stock back on March 18, 2006 but it has not materialized above the 200-d moving average as other MSW stocks have.

3/18/06
LOJN – 22.53
, LoJack is another candidate added this week based on long term support at the 200-d m.a. with a trend buy opportunity right now at the current price. Buy and set a sell stop about 7-10% below the purchase price (slightly below the 200-d m.a.)

Some stocks work, some don’t and this is why we use strict money management rules to push the odds in our favor. If you bought both of these stocks, you would be stopped out of LOJN for a small loss and would be sitting tight with a solid gain in LVS. Since LVS is now above a 20% gain, you should start to think about placing a hard stop to guarantee profits if it were to reverse for some reason. I am still looking for the $60-$100 run for LVS, a move that would give the stock a 60%+ gain over time.

It’s not about winning or losing, it’s about playing the odds! Strong poker players would truly understand this philosophy.

Piranha

Thursday, May 04, 2006

How to Add Shares to a Profitable Position

MSW Member Question:

I had a question about position sizing. Let's say that you have a stock in your portfolio that is up 30% then forms a base/consolidates to a moving average, and you want to add to this position. How would you go about doing this? I know that you're supposed to add less shares when pyramiding up, but would this be considered a second position according to position sizing techniques? Or would you only initially add 2/3 to a position when the stock breaks out then the additional 1/3 if it pulls back?
Thanks

My Answer:

There are a few ways that I have approached this situation. Some of you may agree and some of you may disagree with the way I pyramid or scale my positions when they are in confirmed up-trends after my original entry. When the market is weak and the NH-NL ratio is not confirming a bull market such as 2005 and 2006, I am cautious when I enter a position making a new high. Hypothetically speaking, I will use a $100,000 portfolio and round numbers to keep the examples simple although the CBG position explained in detail is based on a true position.

If I start to research a stock and feel it will travel from $60 to $100, I will determine the maximum position I can assume from a simple position sizing calculation. If I determine I can handle an 8% drop, I am allowed to purchase 208 shares at $60 per share (I’ll typically round it off to 200 shares in this situation). My position size will be $12,500 with a maximum drawdown risk of $1,000 or 1% of my entire portfolio. My stop will be located at $55.20 or slightly beneath a specific support area that is within 8% of my purchase price. If the stock is breaking out of a specific pattern such as a cup with handle, I will buy half my position at the time of breakout and the other half after the trend is confirmed several days later.

If the stock is in a solid up-trend and not in a recognizable pattern, I will typically purchase 2/3rd of the position when I see the opportunity and then follow up with the remaining 1/3rd of the position at the time of the next pullback (only after the stock reaches a minimum gain of 25%).

Other times, when the market is acting healthy and the NH-NL ratio is strong, I will initiate the entire position based on my original 1% position sizing model and reassess the situation at a later date. Using a recent example, I added shares to CBG when it consolidated in the $40’s and then readjusted my position sizing model to 1.5% (the math can become tricky at this point since the price has changed and my portfolio value is different). I have never gotten into this much detail in a simple blog post but I guess now is better than ever. This method is my own so you will not find it anywhere else and it may or may not appeal to everyone.

The following is a true example using actual stock prices but the portfolio size has been altered to keep the calculations simple and to keep my own activity discreet.

When I first purchased CBG, I took on the entire 1% portfolio risk and wasn’t sure if I would ever add shares in the future (this wasn’t my concern at the time). I liked the stock and thought the 15 week pattern that preceded my buy was picture perfect (especially since the correction was due after the prior up-trend from the IPO date). I placed a market order on June 1, 2005 at $38.97 for the entire risk amount of 1%. The stock was already under coverage on the MSW Index since May 21, 2005 at $37.20 but I was looking for a break above $39. I used the calculation of $39 which gave me the purchasing power of $12,500 or 321 shares (my order was filled for 320 shares at $38.97 = $12,470). After I placed the position, the stock immediately reversed but I stayed put as it didn’t violate any sell signals and then watched as it quickly advanced into the $40 range and approached $50. The stock consolidated over the next three months as I held the position and started to cover it more heavily on the MSW Index with a new purchase price of $50. The resistance line was touched several times so I decided that I was going to add shares if the stock broke-out above $50 with confirming volume.

As it turns out, I did add shares when the stock started to form the obvious consolidation during the fall of 2005. I added shares on November 2, 2005 at $52.68 (a little higher than I wanted but it was an extremely powerful move that day). The stock hesitated slightly over the next several days but never violated the new support line of $50. Within six weeks the stock moved towards $60 per share and I felt very comfortable. So, how many shares did I buy and how did I determine the size of my additional position?


When pyramiding up, I have always been taught by my father to take on a smaller position than the original purchase. In this case, my portfolio had grown by about 10% since the summer so I decided that I could take on another 0.5% risk in CBG (a total risk of 1.5% - my maximum risk in any one stock caps at 2% of my entire portfolio). When running the new calculation, I had a portfolio size of $110,000 (hypothetical value) with a 1.5% risk factor or $1,650 risk on the entire position.

I used a price of $50 with a risk factor of 0.5% (half of 1%) with a stop of 8% (typical for my calculations) which gave me the purchasing power of $6,875 or 138 shares. I bought an additional 130 shares and added them to my original position of 320 shares for a total of 450 shares and a total cost of $19,318.80 (minus all fees, etc…). Now, take a look at how this works (it doesn’t work perfectly every time but this time I kept the numbers round): Using the position sizing calculator; plug in a portfolio value of $110,000, a risk of 1.5%, stop loss of 8% and an average cost basis of $45.83 (($38.97+$52.68)/2). What do you get? Amazing: a position size of $20,625 or 450 shares. I currently hold 450 shares with a dollar value slightly lower ($19,318.80) than the maximum calculation in this equation.

The support line is $50 but the stock went on to maintain the 50-day moving average as the true support line heading into 2006. I have not sold one share in this company as I approach one year of holding the stock from the original date of purchase. I will not base my sell on anything but my stop which currently resides slightly below the 50-day moving average. I have a tremendous gain in this stock and I owe it to two things: CANSLIM for finding the actual stock (strong earnings and a recognizable pattern setup) and position sizing for giving me the right amount of shares to purchase. By using the moving average and a retracement stop calculation, I know the exact location to take my profit. Also note that I will most likely scale out of the position if it starts to consolidate in a new range. This is a topic for another day! I always start with a 1% risk factor but will raise my risk factor to 1.5% or even 2% in rare situations when things are working out and I am placing good money after a profitable trade. Again, this is my own personal method so I advise that each individual use what works best for their own portfolio and test several scenarios.

I am open to questions if anyone has them!
Piranha

Tuesday, May 02, 2006

Tracking LoJack, Can it steal the Show?

LoJack Corp. (LOJN) is expected to report earnings this Friday (May 5, 2006) and is another MSW candidate looking to make a “pop” above the long term 200-day moving average. I don’t know if it will be as successful as STRL and ADVS but the setup is very similar so I will place money on the trade and see what happens. If the report is poor, I will take the immediate loss and move on. If the report is positive, I will ride the wave and set a stop to lock in profits as time goes forward.

I make this blog post with a grain of salt based on my recent analysis on the MSW Index last weekend:

4/29/06:
LOJN – 22.11, the stock is in trouble. This is one of the first 200-d m.a. plays that have violated the long term support line without making that anticipated “pop”. Volume is low so we will keep it here until May 5 – earnings day. Place a hard stop to protect against bad news. If good news hits the wire, the stock will fly! Rating: Hold (50-d m.a. trend buy)”

The stock was first added to the MSW Index on March 18, 2006 at $22.53. here was the analysis: "LOJN – 22.53, LoJack is another candidate added this week based on long term support at the 200-d m.a. with a trend buy opportunity right now at the current price. Buy and set a sell stop about 7-10% below the purchase price (slightly below the 200-d m.a.)”

I feel a little better today with the 5%+ gain in early trading on strong volume but anything can happen before the earnings announcement on Friday. Remember, it’s not about winning and losing, it’s about the odds using strict money management rules.

Here is a look at some fundamental numbers for LOJN:
Earnings:
2003: 0.51
2004: 0.64
2005: 0.96
2006: 1.08 (E)
2007: 1.27 (E)

The entire year of 2005:
Q1: 0.14
Q2: 0.26
Q3: 0.30
Q4: 0.25

Q1 2006: 0.17 (E)

Institutional Ownership stands at 68%
Total Number of Institutions: 257 (Money Market: 119, Mutual Fund: 134, All Others: 4)
Institutions Buying Last reporting Period: 75
Institutions Selling Last reporting Period: 16
Top Institutional Sponsor: Wellington Management Company: 1.1mil shares

Let’s see what happens on Friday!
Piranha