Market Talk with Piranha is currently moving to its new home at chrisperruna.com. The new site is up and running but many of the posts need editing as the images and stock charts did not transfer successfully (thanks blogger). I will post all new entries to both blogs – Thank you for your patience while I make this change!

Wednesday, November 29, 2006

Baby Boomer Bust is BULL

This article was originally written last summer but I wanted to bring it to the top of the blog after reading Bill's lastest post over at No DooDahs.
“Boomer Bust?” I Don’t Think So!

I couldn't agree more and can't wait to read his full argument!

July 14, 2006:
I want to post about a subject that frequently appears in discussions online in recent years (especially over the past several months). It's about authors and their sheep followers that continue to predict these great depressions and crashes. I am not saying that it can't happen but their readers sure make them rich by reading most of their negative crap. What happened to the predictions from the books in the late 1970’s and early 1980’s? Read the book titles from the 1970’s and 1980’s and then read the book titles from today (listed below). Are you seeing a pattern? I didn’t go back to the 50’s or 60’s but I could find similar titles and then many more in the 1930’s. My point is: don’t believe everything you read and stop panicking by reading books from theorists (talkers, not doers). I must give credit to many of the books listed by Martin Schwartz and his book Pit Bull. I enjoyed reading it over my last vacation as it was very funny and educational (not a “how to” book).

Theorists make money selling books that sell fear while investors and entrepreneurs make money by following their ideas with money and hedging against a possible crisis. I learn from history and history shows us that these “crisis” books will always sell during tough times. Readers eat up this garbage because most people are trapped in the rat race working their asses off just trying to stay afloat. Their attitudes are typically piss-poor and they love to read about huge negative events (especially a crash that may hurt others).

Also notice how the same authors try to write books when the market starts to go back up again. For example, Howard J Ruff was writing about the crisis in 1979 through 1982 but then started to write about how to invest as a serious investor in 1987. Guess what: he was on the wrong end of the crisis in 1982 (the tail end) and the wrong end of the boom in 1987 (crash later that year). These “fools” are always late to the party and sell millions of books to the “average” person that engrosses themselves in fear!

These people, both now and then are not very accurate, they sell garbage in my opinion and I ignore it at all costs! I just hope many of you can do the same and make decisions based on what “YOU” see and not based on book sellers! Invest for now, ignore the garbage but be prepared for worst case scenarios by taking necessary steps but don’t radically change your life based upon the writings of a few authors that probably don’t invest themselves.

Books from the Past:
Crisis Investing: Opportunities and Profits in the Coming Great Depression by Douglas Casey (Hardcover - Jul 1980)

Crisis Investing for the Rest of the 90's by Douglas Casey (Hardcover - Oct 1993) - WOW was this wrong in 1993!

What the smart money is betting on in 1985: By Doug Casey by Douglas R Casey (Unknown Binding - Jan 1, 1985)

The Coming Currency Collapse and What You Can Do About It by Jerome F. Smith (Hardcover - Sep 1980)

Profits from silver by Jerome F Smith (Unknown Binding - 1983)

How you can profit from the coming devaluation by Harry Browne (Unknown Binding - 1970)

You can profit from a monetary crisis by Harry Browne (Unknown Binding - Jan 1, 1975)

How to Prosper During the Coming Bad Years - A Crash Course on Personal and Financial Survival by Howard J. Ruff (Mass Market Paperback - 1979)

How to Prosper in the Coming Bad Years by Howard J. Ruff (Mass Market Paperback - Jul 1981)

Making money: Winning the battle for middle-class financial success by Howard J Ruff (Paperback - 1986)

Howard Ruff's crash course for the serious investor by Howard J Ruff (Unknown Binding - Jan 1, 1987)

How to Prosper During the Coming Bad Years by Howard J. Ruff (Paperback - April 1984)


Books from Today:
The Coming Collapse of the Dollar and How to Profit from It : Make a Fortune by Investing in Gold and Other Hard Assets by James Turk and John Rubino (Hardcover - Dec 28, 2004)

The Coming Economic Collapse : How You Can Thrive When Oil Costs $200 a Barrel by Stephen Leeb and Glen Strathy (Hardcover - Feb 21, 2006)

Defying the Market: Profiting in the Turbulent Post-Technology Market Boom by Stephen Leeb and Donna Leeb (Hardcover - Jun 3, 1999)

Empire of Debt : The Rise of an Epic Financial Crisis (Hardcover) by William Bonner, Addison Wiggin (November 11, 2005)

The Great Bust Ahead: The Greatest Depression in American and UK History is Just Several Short Years Away. This is your Concise Reference Guide to Understanding Why and How Best to Survive It (Paperback) by Daniel A. Arnold (November 25, 2002)

Image courtesy of http://mirrorimageorigin.collegepublisher.com/media/paper144/stills/x5jf138r.jpg

Piranha

Labels: ,

Tuesday, November 28, 2006

Make Money Selling Short

The headline may sound weak but I borrowed it from the book “How to make Money Selling Stocks Short” By William J. O’Neil. It’s not a book your typical day trader or professional scalper will be interested in reading but it’s ideal for people like me that still trade longer term trends and don’t necessarily do this for a profession. I intend to travel that road one day but now is not my time so I must stick with techniques I believe work and have “actually” worked for me in the past (and present).


I jumped on the potential band wagon early and started to screen for shorts back in early October and I was wrong. More recently, I placed a few positions and was both right and wrong as the market trend was still moving higher and I knew this but I was conquered by human emotion to make the short trades anyway. Luckily for me, two of the trades show a profit while three losers kicked me quickly for smaller losses.


What do I look for when searching for shorts in what I consider reverse CANSLIM? It’s simple; I read the book by O’Neil, study the charts from the past and look for those same characteristics in stocks trading today.


Many traders believe that the most obvious area to place a short would be near the peak of stock’s trading range but I have found this to be untrue.

Characteristics of Longer Term Trend Shorts

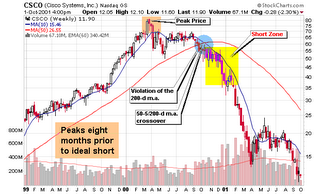
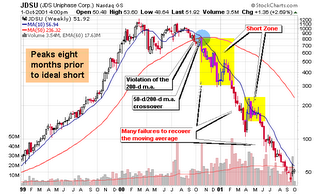
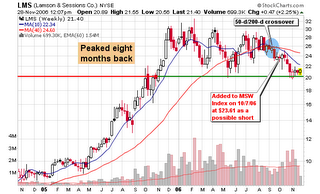
  • Most ideal longer term “trend” shorts take four to twelve months after the peak price to setup on the weekly chart with the majority of these shorts triggering between six to nine months.

  • Look for stocks that had prior up-trends and support levels that can now act as downward resistance or entry areas.

  • Once a stock tops and starts to consolidate, you want it to slice through the 50-d moving average and then the 200-d moving average.

  • A crossover between the 50-d m.a. and the 200-d m.a. is ideal and is graphically presented on each chart in this post

  • The odds of success increase with each failed attempt for the stock price to recover these major long term moving averages.

  • Head and shoulder tops can also serve as ideal setups for potential shorts if they take at least five months to develop.

  • A decreasing relative strength line and a negative pattern on the point and figure chart can also confirm that the stock is rolling over and setting up an ideal short.

  • Finally, volume should be increasing and the stock should be under distribution as it violates the major moving averages and starts to break former support levels.

No one knows when this market will roll over so study the ideal characteristics now so you are prepared to recognize them when they appear. I have screened about two dozen potential shorts in November on MSW with several of them working while the others have failed. I was early with my analysis but more stocks seem to be building bases like the ones from the bubble burst in late 1999 and early 2000. Compare the three examples from today that I have posted to the four shorts from the past that setup perfectly if you would have recognized them six years ago.


For further reading, see my two part article on shorting and the book by O’Neil – the charts alone are worth the price!

Shorting Stocks – The Basics, Part I of II

Shorting Stocks – The Basics, Part II of II


Piranha

Labels: , ,

Friday, November 24, 2006

Top 10 Financial Blogs

This is a list of the top financial blogs I visit each week! They may not be your top picks but they entertain me most and I seem to click on them first. And yes, they are in order of how I click each week! List is strictly blogs!


Trader Mike
Trader Mike trading Diary

The Kirk Report
One pro's view of the stock market

Brett Steenbarger Weblog
In this weblog, I follow research and trading ideas designed to catch short-term moves in the S&P futures market.

Howard Lindzon
TRENDS - Find them, ride them and get off! Stocks, venture and civilization.

Taz Trader Blog
The Swing Trading Guide

BillCara.com
Capital Markets & Social Equity

TraderFeed
Exploiting the edge from historical market patterns

Tale of the Tape
This site is all about moolah, dinero, bread, cheese, cheddar, coin, loot, and bounty. In other words --- MONEY!!!

NYSE Scalper’s Tale
Currently scalp NYSE stocks (hold stocks anywhere from a few seconds to a few minutes) and do not hold positions overnight.

Ticker Sense
Ticker Sense is a blog about everything financial by Birinyi Associates!


Ok, I can’t limit this to just ten; honorable mentions that I always visit each week (multiple times):

Yaser Anwar
Analyzing Investment Ideas that would Outperform the Market. My approach is to dissect Macro Economic Trends, Market Psychology alongside Fundamental & Technical Analysis that shape underlying values of investments from time to time.

Self Investors
Empowering the Self Investor - Growth Stock & Market analysis

Trader-X
Views from a distorted mind. Charts and more charts. Plus sporadic thoughts on the stock market, trading, politics, entertainment, sports, and everything else.

Uglychart
Ugly is doing what many traders would love to do - trade for a living. He trades with a proprietary trading firm (or “prop firm” for short). A prop firm gives you several times your money to trade and then you keep part of the profits.

StockTicker
Stocktickr is free "social investing" site and it's the easiest way to store a watchlist on the web.

Many more excellent blogs live on my blogroll, so take a look as a few of these may move into my top 10 in the future!

Piranha

Wednesday, November 22, 2006

Listen to your Wife, KNOT

The next time your wife is so engrossed into something, pay more attention. I was married in 2004 and my wife planned basically everything on The Knot.com and was addicted to the site (the same way I am addicted to the market – ok, she's not as bad as me). If you speak to my wife, I am actually addicted to the computer; not the market.


Anyway, she used The Knot every day and told all of her friends how great the site was and they too started to use it (many of them became addicted). I am not embellishing the story as they were all extremely addicted to the tools, gadgets and services that The Knot had to offer.

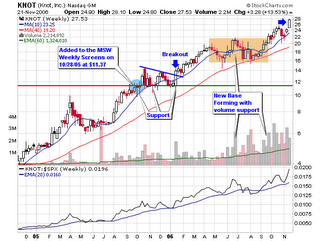
I realized that the company had public stock after if popped up on a CANSLIM screen in 2005 (long after we were married) so I started to study the chart and the financials. Everything looked great and I was ready to buy but am skeptical of stocks trading below $10 per share. To me, I wanted the stock to prove itself before I could place a sizeable position when it was still trading below $20 per share without much institutional attention. I told my wife that I would use some of our speculation dollars to place a position for her. We would essentially call it her stock. She agreed but isn’t very interested in the market so I put it on the backburner but started to cover the stock heavily on MSW. Financials were and still are solid, the chart was and still is trending higher and it kept making new 52-week highs – my bread and butter (the CANSLIM way).

So what is The Knot? (from their site):

The Knot (http://www.theknot.com/) is the most comprehensive resource for couples seeking information and services to help plan their weddings and their future lives together.

The Knot Inc., Weddings for the Real World, is one of the world's leading wedding media and services companies, providing today's to-be-weds with comprehensive wedding planning information, interactive tools, and resources. With a fresh voice and real-world sensibility, The Knot has extended its brand to every venue brides and grooms turn to plan their weddings -- online at the #1 wedding website, TheKnot.com, and on newsstands and in bookstores nationwide.

Shortly after securing seed financing from America Online, The Knot Inc. secured additional rounds of funding from industry giants Hummer Winblad Venture Partners and QVC, Inc. In December 1999, The Knot raised $35 million in its initial public offering. And in February 2002 The Knot received additional backing from The May Company.

With over 2 million unique members and more than 4,200 new members a day, The Knot has the largest audience -- bar none -- of wedding-obsessed, cash-wielding brides.

Each year approximately 2.4 million couples get married in the United States, generating approximately $70 billion in retail sales annually. Presumed to be a once-in-a-lifetime occasion, a wedding is a major milestone and, therefore, consumers tend to allocate significant budgets to their weddings and related purchases.

The average amount spent on a wedding is approximately $20,000, excluding the honeymoon. (I wish my wedding only cost $20k; I could have taken the other half and placed it into The Knot and paid for everything and then some, all for a long term capital gain.)
*********End************

Since my initial coverage in August 2005, I actually placed the KNOT onto the MSW Index on 10/28/05 at $11.37 for a current 13 month gain of 142%. The stock is up 192% from August 11, 2005, the first official day I studied the stock and placed it on a MSW daily screen. I never bought the shares for my wife and regret every minute of the decision because I was only using speculation dollars and the risk wasn’t too bad as the stock was trending higher. I admit that I am uncomfortable buying low priced stocks and could have cut it if it reversed but it never violated the 200-d moving average so I would have held the entire time (for her).

She found and used a great service, a product that makes brides-to-be extremely addicted and I missed the opportunity when it stared me in the face! I knew it, I talked about it and even recommended it to a community of hundreds of investors but didn’t pull the ultimate trigger myself. The stock hit an all-time high yesterday at $27.53 and has been increasing volume since early 2005 as I would assume that institutional investors are finally jumping into a stock that makes money from a cash happy demographic. They fill a niche and turn a healthy profit so I consider them a solid stock. It is currently extended for an entry but I will continue to monitor the shares into the future.

Listen to your wife, especially when everything makes complete sense (it’s not too good to be true)!

Here are some of the analysis entries from MSW in 2005:

8/11/05:
Interesting Stocks forming bases:
KNOT – 9.41, deep cup shaped base that has shot up over 20% in the past two weeks. I was married not too long ago and I’m familiar with this company, due to my wife. Look for a handle to form on the right side of the base.

9/26/05:
KNOT – 11.30, the Knot has made five daily screens and I told many of the husbands or husbands to be to ask their significant others about this website and company. They are creating quite the buzz in the wedding world, especially here in the metro NY area. The stock is not perfect but the company is starting to turn a nice profit on brides-to-be. Up 20% since our first Daily screen on 8/11/05 at $9.41.

10/24/05:
KNOT – 13.50
, up 4.09% on volume 220% larger than the 50-d m.a. We have been screening the Knot Inc. since it crossed $10 per share. It is now extended but it is still in a solid up-trend.

10/25/06:
KNOT – 13.84, up another 2.52% on volume 126% above the average but I do see a pullback in the near future. The stock is moving up too high too fast to sustain this type of advance. A pullback should present a new buying opportunity back near $11.50 to $12.


10/29/05 – Weekly Screen Debut
KNOT – 11.37, I have been following the stock on the daily screens for two months as the stock became extended. With the recent move back to the 50-d m.a., the stock is now on our watch list.

11/17/05:
KNOT – 12.35
, I have screened the stock several times over the past two months as it holds the 50-d m.a. support. Today’s move on volume 158% larger than the average shows that this small company has some punch. Trust me guys (that aren’t married), brides to be can spend a lot of money and the industry seems to be recession proof for the most part. Today was a triple top breakout on the P&F.

Removed on 1/7/06 from the weekly screen! – What a mistake (it wasn’t too good to be true)!


Blog Mentions in 2006:

7/17/06:
http://marketstockwatch.blogspot.com/2006/07/msw-market-overview.html
Looking at the MSW Watch list from last week, we see one solid stock:
KNOT: -1.29% (down less than the major averages)

1/26/06:
http://marketstockwatch.blogspot.com/2006/01/mini-daily-screen.html
KNOT – 14.44, as you know, we cut the stock from the MSW Index when it fell below the 50-d m.a. but it has since reversed, gathered strength and moved to new highs. It will not be back on the Index but I thought it deserved some notice.

1/8/06:
http://marketstockwatch.blogspot.com/2006/01/recent-msw-index-results.html
Another stock has been removed (KNOT) but it was showing a 2% gain when it was cut yesterday. I decided to remove the stock before the very small gain turned into a loss.

12/4/05:
http://marketstockwatch.blogspot.com/2005/12/using-stock-research-and-stock.html
Our double digit gainers over the past two weeks include: AAPL, NWRE, CUTR, ESRX, OXPS, KNOT, HANS, & LMS. Three of them were priced within the $60-$100 range as these impressive gains accumulated over the Thanksgiving holiday.

Piranha

Labels:

Monday, November 20, 2006

Secondary Indicators telling Stories

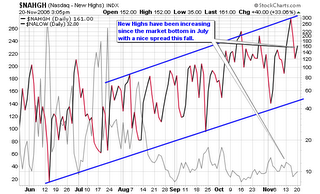
The New High – New Low ratio (NH-NL) had its highest average number of new highs last week with a final tally of 541-55. It was only the fifth week of the year that had new highs average 500 or more stocks per day. It was also the highest new highs weekly average since the spring of 2005 (prior to me publishing the breakdown with the NH-NL chart). Daily new highs topped 613, 756 and 620 during the middle of last week for the best three day run of 2006 with Wednesday, November 15, 2006 giving us the strongest one day total since Wednesday, April 19, 2006 when the ratio finished at 759-61.


That was the second strongest week of the year with an average ratio of 540-75, just one new high per day less than this past week (new lows averaged 20 less last week than they did during that week in April). Even though the market averaged more than 500 new highs per day, the weakest total came on Friday as new highs dropped considerably as you can see in the table below:

New Highs vs. New Lows - Daily Breakdown, 11/13/06-11/17/06:
Monday showed a ratio of 423-59
Tuesday showed a ratio of 613-71
Wednesday showed a ratio of 756-58
Thursday showed a ratio of 620-40
Friday showed a ratio of 291-46

The accompanying chart shows us the up-trending fashion of new highs on the NASDAQ over the past six months. June and July were very sloppy with mixed results as separation became very clear in mid-August as new highs accelerated their advance while new lows decreased considerably and maintained a low profile.

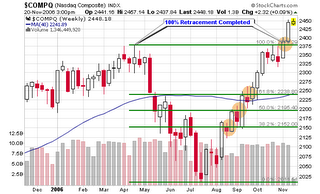
The NASDAQ completed the 100% retracement that I have been following since August here on the blog and has blasted higher on above average volume. As you can see, the index stalled briefly at each retracement level before moving higher and did so in perfect Fibonacci fashion. I am not a complete Fibonacci buff but I do watch for these levels as they seem to apply in longer term weekly charts more often than not.


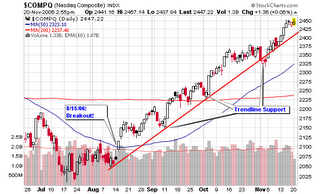
Viewing the daily chart, we can see that the NASDAQ is still trending above the support line that dates back to early August with one slight violation earlier this month. I thought that was the trend reversal but the market quickly proved me wrong and forced me to cover a couple short positions. I also covered a few long positions that actually went higher but I can’t complain because getting out on top is not the objective when trading. Trading the signals and making a profit is my sole objective (picking bottoms and tops are great for blog stories but don’t translate well to portfolios – at least not mine).


The number of stocks trading above their 50-d moving average in the chart titled $SPXA50R is flirting around the extended area of 80 for the first time since November and December of last year. The lesson we can learn here is the fact that the market didn’t roll over until May of 2006 which means that this secondary indicator is a warning of what may come in the future. I can say this with confidence because the indicator also bottomed a full month in advance of the NASDAQ bottom in July but predicted the move perfectly. Again, this is only a secondary indicator but we are now one month removed from the first peak above the 80% level which could be the start of the warning bells and red flags that the up-trend is winding down. The last topping warning took almost five months to materialize so keep that in mind.


Another of the interesting secondary indicators we have been following on this blog is the relationship between large cap and small cap stocks. Small caps have been beating up larger caps in terms of performance since June 2000 with a few slight down trends from time to time. This was a year where large caps took the lead and were outperforming their smaller cap peers until the past two months. Small caps started to gain strength heading into the election and bounced off of the imaginary trendline on the chart below and have started to catch up in gains with their large cap friends. Many of these smaller cap growth stocks can capture sizable gains in shorter periods of time versus their large cap peers and this is why the overall trend has been higher for the greater part of this century. I wrote about the strength among large caps several times this year but I am firmly invested in smaller cap companies such as the ones listed on the MSW Index.


Some of the recent top performers from the MSW Index are listed below. As you can see from the numbers posted at the end of the day last Friday, the NASDAQ is quickly catching up to the performance of the DOW and S&P 500 in 2006. The NASDAQ was once down about 10% for the year and is now up over 10% and only 5% behind the DOW. How quickly things can change.

Where do the Major Indexes stand in 2006?
NASDAQ: +10.91%
DOW: +15.16%
NYSE: +14.74%
S&P 500: +12.25%

Top Performing MSW Index Stocks last week:
ICE: 18.90%
LRCX: 8.46%
ISE: 5.09%
LVS: 3.91%
JLL: 3.39%
GILD: 3.10%
AB: 2.28%

Here are the total gains of the current crop of MSW Longs:
LRCX: 19.88%, since 9/30/06
BLKB: 34.52%, since 8/5/06
LVS: 59.99%, since 4/1/06
GILD: 11.12%, since 7/29/06
ICE: 37.33%, since 9/23/06
EZPW: 29.39%, since 6/24/06
AB: 16.23%, since 7/29/06
ISE: 17.31%, since 8/19/06
JLL: 9.29%, since 9/9/06
NEU: 32.66%, since 7/29/06
DIOD: -5.75%, since 10/21/06 *currently the only down stock among longs

*11 Stocks (longs) have been cut for slight gains and/or small losses over the past couple of months which gives the index a 56% win-loss ratio in 2006. Twelve short candidates live on the MSW Index with two of them recently covered for losses.


Piranha

Labels: ,

Wednesday, November 15, 2006

Tuesday's MSW Daily Screen

Since I posted my first completely positive (longs only) screen last night (in November), I decided to share it with everyone on the blog. I still view the market as extended but it is trending higher and until that trend is snapped, shorting stocks will carry risk (at least shorting them the way I do – following the O’Neil approach from his book on shorting). I will post a list of stocks with charts tomorrow that show similar characteristics to the ones highlighted in O’Neil’s book on shorting.


Many of the market’s leading stocks powered higher Tuesday including several MSW Index members such as:
LVS, ICE, ISE, LRCX, JLL

As explained below, a couple of these MSW Index stocks clearly vaulted past their pivot points which were highlighted on the weekly screen over the weekend. The NASDAQ is now up 1.71% for the week and is far above the former 100% retracement level that was established back in April 2006. If you pull out on the charts and look at a two year weekly view of the NASDAQ, you will see the deep v-shaped pattern with handle and pivot point breakout to new highs (the highest point since 2001). The NASDAQ daily chart clearly shows how the index is climbing along the trend-line I have highlighted in red. Remember, I have been screening shorts over the past several weeks but none of the major indexes have reversed the trend even though they are all extended. Until the trend snaps, we must tread carefully when placing shorts. Due to the extended nature of the market, we must also tread carefully when placing longs or adding shares to current positions.

All major indexes moved higher in above average volume as the recently weak retail sector decided to take some leadership. Looking at my charts through the link below, we can see that small caps are gaining strength versus their larger cap peers. Along with these small caps, many growth stocks are starting to come to the head of the class and flex their muscle just as IBD stresses in tonight’s eIBD edition. IBD mentions how the S&P 600, the small cap index, is within 1% of an all-time high. One of the most impressive numbers of the day was the NH-NL ratio finishing at 613-71 as advancing issues beat declining issues (6,314 to 3,657).

REMEMBER THE ‘M’ IN CANSLIM!
Current Environment: Short term plays (long or short)! The market is extended but trending higher.

Interesting Stocks making New Highs:
  • ICE – 96.55, the MSW Index stock blasted 9.10% higher today on big volume and now has a 31% gain on MSW since 9/23/06. I called for a new buy above $88 this past weekend

  • LVS – 92.00, up another 4.75% today for a 62% gain on the MSW Index since April of this year. The stock is now up almost 30% in the past two weeks. Now in the final stage of the $60-$100 run (lock in all gains above $89 or 75% of the run)


  • TM – 124.82, a six month cup shaped pattern that should form a handle before grabbing new shares. Toyota was screened daily several times near the 200-d m.a. above $100 earlier this year

  • NTY – 33.19, a double top breakout on the P&F chart on above average volume (a 12.32% gain today)

  • EDU – 31.85, an interesting young stock that is trending higher that may be entering extended territory. The support/resistance zone stands at $28

  • CTSH – 79.55, a gap-up to new highs that almost erased during the day before trending higher during the afternoon. The ideal trend buy is still near the 50-d m.a.

  • GROW – 39.64, now up over 8% this week as the stock continues to make new highs. “stocks that make new highs typically continue to make new highs until the major trend is snapped”.

  • NICE – 32.58, the second consecutive gap-up for a total weekly gain of 9.18%. The previous triple top breakout took the stock from $29 to $33 which now acts as the ceiling for the potential double top breakout

  • LRCX – 55.04, up 3.36% today for a total weekly gain of 9.86% on above average volume. The stock blasted past our pivot point of $52.53 and is now up 21.42% on the MSW Index since 9/30/06

  • CTRP – 58.88, the former MSW Index stock is making new highs after becoming a 200-d m.a. play last month. It is up over 20% since mentioned as a 200-d m.a. play in October.

Interesting Stocks within 15% of New Highs:

  • FFIV – 72.07, a very deep seven month base without a handle formation at this point in time. An ideal pivot point will develop after the proper handle formation

  • WCG – 62.20, a trading range between $57 and $64 will determine a buy or sell but note that some heavy distribution weeks cast a dark cloud near new highs

  • ISE – 50.49, the stock has formed the handle to the long term cup shaped base and has a pivot point of $55.23 and support above the 50-d m.a. Up over 4.51% for the week and up almost 17% on the MSW Index

  • TWGP – 33.56, the former MSW Index stock is back above the 50-d m.a. on strong volume. The 200-d m.a. is still the long term support and the up-trend indicator

  • ININ – 18.75, the stock is approaching the $20 level which typically acts as resistance when making new highs so be careful not to chase it into extended territory

  • RVSN – 21.20, a nine month cup shaped base that has completed the right side as it is within cents of the 52-week high (the left side of the base). Look for a handle to form with a pivot point before grabbing shares

  • HWCC – 23.78, a double top breakout has setup on the P&F chart with a short term entry above $25

Piranha

Labels: ,

Friday, November 10, 2006

How the Poker Craze can Help you Trade


As promised, I have uploaded the excerpt of my article from the latest edition of The Trader’s Journal.

The article explains on the basis of position sizing and expectancy and how poker has made me a better trader.

Enjoy:

How the Poker Craze can Help you Trade
Piranha

Labels:

Monday, November 06, 2006

Wall Street Journal Online Mention

I noticed that my traffic was up today but the source was new:
The Wall Street Journal Online edition.

I was mention by David A. Gaffen in the Market Beat section at 10:30am this morning. Market Talk with Piranha was added to the box “Blogs We’re Reading” at online.wsj.com. I am honored to be mentioned by such a large publication and thank David for following my analysis. I also want to thank Yaser for the screenshot!


Piranha

Labels:

Market Snapshot

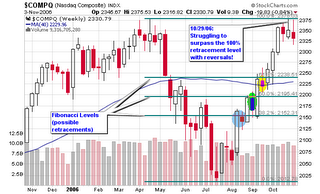
I will start with the NASDAQ and will focus on the Fibonacci Retracement chart as the Index is having trouble moving through the 100% retracement level. The index has reversed from highs over the past three weeks but did not flash distribution (as a week) this past week. The NASDAQ has flashed four distribution days over the past month which is enough to signal a major market reversal according to CANSLIM rules.


One could also view the weekly chart of the NASDAQ as a deep six month V-shaped pattern with a handle formation. As humans, we can’t argue which chart is correct (the Fibonacci or V—shaped) so we must focus on signals and trade according to those signals. If the market breaks out above the handle, it is telling us to place long positions just as it is giving us the green light to place shorts or buy put options with a continued Fibonacci reversal.

Take a look at the second Fibonacci chart provided which shows where the NASDAQ may reverse if it can’t regain its footing. The logical area would be near the 200-d moving average which is also near the first 38.2% retracement level of 2,239. This same area also serves as the original drop back in May 2006 near the 200-d m.a. Nothing is guaranteed but the signals and setups are there so trade them and cut a loss if you are wrong. It’s not very difficult.


Please remember that Fibonacci retracements are still secondary indicators when compared to price and volume; so don’t make your ultimate decision on a secondary tool. The daily chart of the NASDAQ still shows a trading zone between 2,325 and 2,375 as highlighted in blue on the charts provided. The trend line was snapped as the index is moving sideways with the recent distribution days. Price and volume along with several secondary indicators now point down for the NASDAQ.


The DOW has gained more than 12% over the past four months with an almost straight-up pattern without many breathers. The index reversed from its highs two weeks ago and dropped 0.86% last week on below average volume. The S&P 500 is following the same pattern as it too trades near all-time highs but the weekly down volume continues to come on less than average volume. I have added a Fibonacci graphic on the DOW chart to give you an idea where this tool believes the market will correct. Ironically, the first 38.2% retracement level sits exactly where a handle should have formed before the index moved higher (according to CANSLIM setups).


Other secondary indicators that tell us that the market wants to move lower is the NH-NL ratio which has weakened considerably for the first time in five week as new highs dropped below an average of 300 per day for the first time since late September as new lows have increased to their highest total in a month. We had 688 new highs and only 46 new lows two weeks ago Thursday but had a completely different story told this past Thursday with only 148 new highs and 87 new lows. That’s a 78% decrease in new highs and a 90% increase in new lows. Subtle clues like this can and will paint the picture of what’s going on with the strongest stocks in the market (the leaders). I use the NH-NL ratio as my number one secondary indicator and actually consider it my 1a indicator since it has proven to be so reliable after basic price and volume.


Another indicator is the percentage of stocks trading above their 50-d moving average which spent the past several weeks in overbought territory but has dropped considerably over the past five days (down 13.40% for the week). It took the NASDAQ three months to reverse after this specific indictor gave its signal earlier in the year but the market wasn’t climbing at the extreme angle it is today. It only took the market one month to reverse to the up-side after this indicator gave the over sold indicator in June. Look at the charts page and focus on the light purple line that is plotted behind the chart to see when the NASDAQ was making its move up and down in 2006.


Crude oil is still trading in the range highlighted on the weekly chart and is actually showing more weakness but I have been saying that the elections would probably hold the price down. Gold broke out successfully above the triangular formation that I highlighted last month on the weekly chart and was up over 4.5% for the week as it is trading back at its highest level in two months.


Piranha

Labels:

Thursday, November 02, 2006

Published for the First Time

I am proud to say that I will be published for the first time next week in a magazine titled:
The Trader’s Journal


"Asia Pacific's Pre-eminent Trading Magazine is a product of DPR International Pte Ltd based in Singapore and distributed to Hong Kong, Malaysia, and Australia. Our primary focus is to research and educate you. It can be easily argued that it is the educated trader that will survive in the markets and we want to be a large part of your education.

The publisher, Dickson Yap, has a long history in the industry. Prior to launching the Trader’s Journal magazine, he worked in the Dow Jones Singapore office doing advertising and circulation. His businesses serve thousands of customers around the world in every time zone."

Some very prominent authors, traders and educators have contributed and still contribute to the magazine so I am honored that they published my article. Here are some of the names you may be familiar with:

Van Tharp
In the unique arena of professional trading coaches and consultants, Van K. Tharp stands out as an international leader in the industry. Helping others become the best trader or investor that they can be has been Tharp's mission since 1982. Dr. Tharp offers very unique learning strategies, and his techniques for producing great traders are some of the most effective in the field. Over the years Tharp has helped people overcome problems in areas of system development and trading psychology, and success related issues such as self-sabotage. http://www.iitm.com/

Tom Bulkowski
Thomas Bulkowski is an author and private investor. Before earning enough from his investments to “retire” at age 36, he was a hardware design engineer working at Raytheon on the Patriot air defense system and a senior software engineer for Tandy Corporation. http://mysite.verizon.net/resppzq7/

John F. Carter
John F. Carter grew up the son of Morgan Stanley stockbroker, and was introduced into trading as a sophomore in high school, and has been trading actively for the past 19 years. He studied international finance at the University of Cambridge in England before graduating from the University of Texas at Austin. In 1999, he launched www.tradethemarkets.com to post his daily trade setups in futures and equities. More recently he launched www.razorforex.com to focus on forex trading research and trading strategies. He’s a Commodity Trading Advisor with Razor Trading, and manages a futures and a forex fund.

Brett N. Steenbarger
Brett N. Steenbarger, Ph.D. is Associate Clinical Professor of Psychiatry and Behavioral Sciences at SUNY Upstate Medical University in Syracuse, NY and author of The Psychology of Trading (Wiley, 2003). As Director of Trader Development for Kingstree Trading, LLC in Chicago, he has mentored numerous professional traders and coordinated a training program for traders. An active trader of the stock indexes, Brett utilizes statistically-based pattern recognition for intraday trading. http://www.brettsteenbarger.com/

NOTE:
Brett has just released his latest book which I have not read (yet) but have provided a link since he will also be published in the November issue of The Traders Journal.

Enhancing Trader Performance: Proven Strategies From the Cutting Edge of Trading Psychology (Wiley Trading) (Hardcover)
by Brett N. Steenbarger

http://traderfeed.blogspot.com/2006/10/finding-your-performance-niche.html

Price Headley
Price Headley is the founder of BigTrends.com, which provides investors with specific real-time stock and options strategies and investment education to profit from significant market trends. He has appeared on CNBC, Fox News, CNNfn, Bloomberg Television and a variety of print and online financial news outlets, including The Wall Street Journal, Barron's, Forbes, Investor's Business Daily, USA Today, and Bloomberg Personal. http://www.bigtrends.com/

Jim Wyckoff
Jim Wyckoff has been involved with the stock, financial and futures markets for more than 20 years. He was born and raised in Iowa, where he still resides. Wyckoff became a financial journalist with Futures World News for many years, cutting his teeth as a reporter on the futures trading floors in Chicago and New York, where he covered every futures market traded in the United States at one time or another. http://www.tradingeducation.com/

Robert W. Colby
Robert W. Colby is managing director of Colby Research in New York and the author of The Encyclopedia of Technical Market Indicators, which has become the standard reference work throughout the world for technical indicators and trading systems design http://www.tradingeducation.com/

For a complete list of contributors, visit their site: http://www.traders-journal.com/issues/contributors.html

Piranha

p.s. - So what am I writing about?

How the Poker craze can Help you Trade
It’s a 2,800 word article that compares the detailed similarities between trading and poker which have helped me become better at both. I will upload the entire article to this blog after it has been released in the magazine.

Labels: , ,