Market Talk with Piranha is currently moving to its new home at chrisperruna.com. The new site is up and running but many of the posts need editing as the images and stock charts did not transfer successfully (thanks blogger). I will post all new entries to both blogs – Thank you for your patience while I make this change!

Monday, March 27, 2006

STRL – Sterling Construction hits Retracements

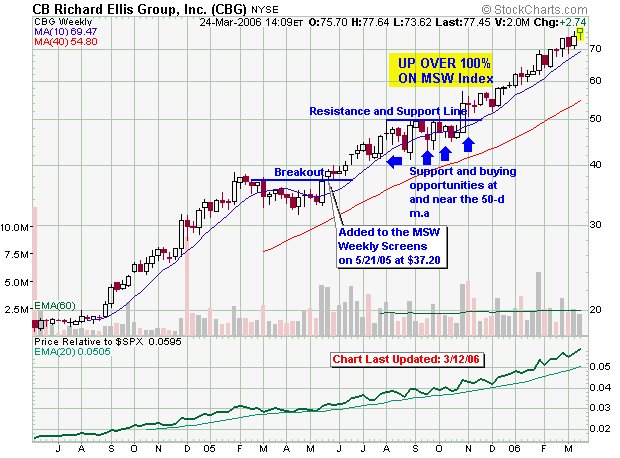
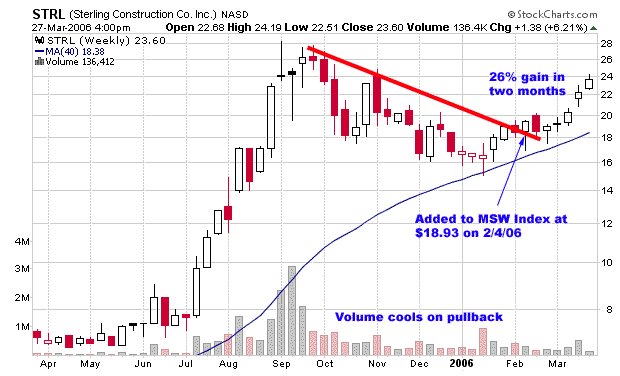
I started to cover Sterling Construction (STRL) on the MSW Index on February 4, 2006 at $18.93 as it gained support at the 200-d m.a. I purchased shares for myself at $19.05 the following week. The stock almost violated a mental sell stop but I held due to support below and have been rewarded with a 26% gain in less than two months. I wrote an extensive blog post here about price targets and retracement levels for STRL, including a chart.

In that post, I said:
“The first method to determine if the stock had bottomed is the use of the Fibonacci retracement levels (in this case, the 38.2% retracement which equals $15.46). It turns out that this retracement level also corresponds with the 200-d m.a. support and lifted the stock higher. Turning to the retracement level on the positive side, the method predicts a top at three common locations:
61.8%: $23.26
50.0%: $21.13
38.2%: $20.13”

Today’s close above the 61.8% retracement level on strong volume gives us a positive feeling about the stock. My target of $30 still exists for the year and my prior post explains where that number was derived.

Piranha

Friday, March 24, 2006

CB Richard Ellis Group, CBG, is an All-Star Stock

CB Richard Ellis Group, Inc. (CBG) was first screened on MSW on Thursday, May 19, 2005 at $37.22. We established a breakout and/or pivot point of $38.95 and declared a strong support level near $33.00. I instantly saw a company with great potential even though we weren’t talking about a new technology or juicy subject. The chart at the bottom of this blog post shows what I was looking at last summer as the stock started to make its run. Here is a link to a blog post I made in August 2005 after the stock was already up over 30% in 10 weeks:

CBG Blog - August 2005

The stock ran into resistance early last fall but we held tight since it wasn’t violating the 50-d m.a. with distribution days. For 13 weeks, the stock traded sideways before breaking out once again, above $50 per share. It hasn’t looked back and is trading at a new high once again today above $77 per share. The stock has made 40 consecutive weekly screens (now referred to as the MSW Index). If the stock continues to travel through the $60-$100 run, it will become a long term capital gain and those gains will be well over 100% in only twelve months without much risk along the way. Looking at the chart, we can see the slow steady growth since the original breakout in May 2005.

Keep one thing in mind: Don’t hold the position for tax implications if it suddenly started to fall. Sell immediately and take the profits because they should exceed the difference between short term and long term capital gains (if the stock tanks). If it trades sideways or better yet, continues to move higher, hold and don’t sell until we see the first set of red flag warnings.

Now I will compare the fundamental numbers I crunched in August 2005 and some new numbers I crunched earlier today:

***Note the difference in institutional supporters over the past 10 months (almost 400 new institutional holders which explains the 100% advance perfectly!***

Current Fundamental Numbers (3/24/06):
3-Year EPS Rate: 97%
3-Year Sales Rate: 40%
PEG Ratio: 1.17
ROE: 32%

Updated EPS Analysis:
2003: -0.34
2004: 0.91
2005: 2.84
2006: 3.60 (E)
2007: 4.17 (E)

Number of Institutions (last reporting period):
Total: 523
Money Mangers: 207
Mutual Funds: 296
Other: 20

August 2005 Fundamental Numbers:
3-Year EPS Rate: 65%
3-Year Sales Rate: 54%
PEG Ratio: 1.20
ROE: 22%

EPS Analysis:
2003: -0.23
2004: 1.65
2005: 2.24 (E)
2006: 2.39 (E)

Number of Institutions (last reporting period):
Total: 111
Money Mangers: 51
Mutual Funds: 56
Other: 4


Piranha

Thursday, March 23, 2006

Southwestern Energy (SWN) a short?

Looking at a multi-year chart, you would not want to challenge the institutional support that Southwestern Energy Co. (SWN) has received for the past several years at the 200-d moving average. The stock has increasing quarterly and yearly earnings.

Yearly EPS:
2003: 0.37
2004: 0.70
2005: 0.94
2006: 1.23 (E)
2007: 1.56 (E)

Return on equity has been average when compared to its peers but not overwhelming. Revenues are rising and the debt-to-equity ratio is below the industry average. Above all else, it resides in an industry group that has been leading the market for the past two years while oil prices continue to increase and trade above $60 a barrel.

So why would I consider shorting the stock or buying several put options?
For starters, it violated the 200-d m.a. for the first time in almost three years.
It attempted to recover the moving average and failed, another event that hasn't occurred in years.

The short position or put options can be placed (or bought) right now but I must warn that oil is still trading above it's respective 200-d m.a. Unless oil cracks $60 and breaks below its own moving average, this play may not work out. If you initiate the position, make sure you use the correct position sizing techniques and protect yourself from a move to the up-side.

It's ok to be wrong but its not ok to be wrong and sit without getting out of the position. If (SWN) fails to recover the 200-d m.a. once again, this will be a strong signal to place the position if you don't do it before then.

Good luck, we'll see what happens.
By the way, I am not bearish or bullish on the market, I am just searching for opportunities.


Piranha

Wednesday, March 22, 2006

Google Finance

When I woke up today and started to study several stock charts and then the statistics at my websites, I noticed a huge increase in traffic to my blog. I couldn’t believe the spike in traffic and the number of people that already visited my blog today (it was only 7am EST). I quickly checked the statistics and realized that the traffic was coming from a new source. I was amazed to see how many of my blog posts were placed number one or two on the new Google Finance page - blog section.

My posts about Hansen Natural (HANS) seemed to be the top supplier of new traffic. I took a look at Google Finance and it follows the format of the original Google and has several features that I already like better than yahoo finance.

I am already adding this site to my favorites and found an interesting article on Trader Mike's page talking about Google Finance

Take a look and enjoy!

My typical daily screens will return tonight on MSW.
Piranha

Monday, March 20, 2006

Interesting Stock Market Links

As many of you know, I have been dealing with a death in the family so my research and analysis has been limited over the past week. Today’s blog post will contain some interesting stock links and information about a few MSW Index movers and shakers.

Movers today on the MSW Index:
BOT – up over 5% as we prepare to close trading for the day. The stock was up as high as $125 in intraday trading on above average volume.

STRL – up over 8% prior to the close today after Q4 earnings were released. Profits were up for the stock that has been trending above the moving average for several weeks.

NWRE – up almost 6% at 3:50pm as the stock challenges last week’s high

VIVO – up almost 8% as we set to close trading for the day. The stock moved on volume almost double the 50-d average.

On the downside:
TALX – down almost 8% as the stock was hit hard in heavy volume (looking to gain support at the 200-d m.a.) Remember what I said on the MSW Index; if it holds the 200-d m.a. as support, a trend buying opportunity exists. The stock has not violated the line since mid-2004.

A low priced stock to watch:
CAMP
– I listed the stock as a risky trend play on Saturday and said: “a risky low priced stock that is looking to pop with support at the 200-d m.a.” The stock jumped more than 4% today to close slightly below the 50-d m.a. The (recent) weekly chart looks very similar to STRL with support at the 200-d moving average

While I am grieving with the family tonight and tomorrow with viewings and the mass, I wanted to draw your attention to some other excellent stock market blogs, articles and posts:

Cramer's Calls a Crap Shoot
Averaging the 1077 gains of 2.88% with 477 losses of 3.52% we get a whopping total gain of 0.5%.

Trader Mike: Stock Market Quick Links
Recent Stock Trading Related Links from Trader Mike (a great blog by the way).

Fickle Trader Blog
An excellent market blog from a market enthusiast with screens based on his proprietary market homework. I met Jon on the Richdad forms several years back.

Trend Following with CANSLIM
Jim, one of our own at MSW, using strategies from CANSLIM and long term trend following to obtain outstanding returns in stocks, commodities, and forex.

Has trading got tougher lately? Let's find out...
By Brett Steenbarger at TradingMarkets.com (found through Trader Mike)

Money Management, Bet Sizing, Position Sizing All Mean the Same Thing
Money Management has many names: asset allocation, position sizing, bet size, portfolio heat, portfolio allocation or even risk control. It is terribly important for long term success. It is at the root of all trend following winners.

Trader Mike on Position Sizing
Position sizing could very well be the most important aspect of a trading system, yet, like expectancy, it's rarely covered in trading books.

Falkin Investing Organization
The FIO is a 501c status pending non profit organization dedicated to the stock market. Established in December 2005, the Organization was created as a way to connect traders of all experience levels across the globe without the spamming, bashing, or just an overwhelming presence of, "must buy products". I have gotten to know the president (slightly through e-mail), Blain Reinkensmeyer, over the past several months. He is a young, ambitious, entrepreneurial-minded person with a bright future following his passions. Good luck with the new website!

Enjoy,
Chris

Wednesday, March 15, 2006

Position Sizing - Why Losing isn't Everything!

I have been arguing (going back and forth) with a “so-called” investor on another forum and he questioned my trading methods and claimed I would lose 76% if I took 8 consecutive 8% losses. Knowing me, I had to breathe deeply, release the anger from a person who knows nothing about position sizing and teach him a simple math lesson. The following example is simplified to allow you to understand what is happening. In the real world, things are a bit more complicated with commissions, emotions, slippage and the like.

Enjoy the position sizing example. It shows you how you can lose 80% of the time (worse case scenario); yet still come out a slight winner.


If I start with $100,000 and lose 8 consecutive trades at 8% (only risking 3% of capital with 8% stop loss), this is what it looks like:
$100,000 portfolio
3% risk per trade
8% stop loss

1st Trade:
Risk will be $3000 = ($100,000*3%)
Amount to Trade at 8% stop: $37,500 = ($3000 / 8%)
An 8% stop loss will cost me $3000

2nd Trade:
Risk will be $2,910 = ($97,000*3%)
Amount to Trade at 8% stop: $36,375 = ($2,910 / 8%)
An 8% stop loss will cost me $2,910

3rd Trade:
Risk will be $2,822 = ($94,090*3%)
Amount to Trade at 8% stop: $35,283 = ($2,822 / 8%)
An 8% stop loss will cost me $2,822

4th Trade:
Risk will be $2,738 = ($91,267*3%)
Amount to Trade at 8% stop: $34,225 = ($2,738 / 8%)
An 8% stop loss will cost me $2,738

5th Trade:
Risk will be $2,655 = ($88,525*3%)
Amount to Trade at 8% stop: $33,198 = ($2,655 / 8%)
An 8% stop loss will cost me $2,655

6th Trade:
Risk will be $2,576 = ($85,873*3%)
Amount to Trade at 8% stop: $32,202 = ($2,576 / 8%)
An 8% stop loss will cost me $2,576

7th Trade:
Risk will be $2,498 = ($83,297*3%)
Amount to Trade at 8% stop: $31,236 = ($2,498 / 8%)
An 8% stop loss will cost me $2,498

8th Trade:
Risk will be $2,423 = ($80,798*3%)
Amount to Trade at 8% stop: $30,299 = ($2,423 / 8%)
An 8% stop loss will cost me $2,423

Total loss after 8 trades: $19,201
This loss totals 19% (minus commissions etc…)

TRADE #9:
Risk will be $2,351 = ($78,374*3%)
Amount to Trade at 8% stop: $29,390 = ($2,351 / 8%)
An 8% stop loss will cost me $2,351
**This trade ends with a 40% gain: $11,756 = ($29,390*40%)**

Original amount: $78,374 + $11,756 = $90,130

TRADE #10:
Risk will be $2,703 = ($90,130*3%)
Amount to Trade at 8% stop: $33,787 = ($2,703 / 8%)
An 8% stop loss will cost me $2,703
**This trade ends with a 30% gain: $10,136 = ($33,787*30%)**

Total portfolio worth: $100,266

WOW – a profit with 8 consecutive losing trades and 2 winning trades!
That is a 20% winning percentage but it gave me an end result of a slight profit!

This is how money management works!

Now just imagine have a winning percentage of 40% or greater and cutting some of those losses at less than 8%, your portfolio could easily gain 50% or more in one year with a 40% winning percentage based on simple position sizing!

This is how TRUE investors and traders take money out of Wall Street.
Piranha

Ctrip.com (CTRP) Updated

Last August (2005), I posted a case study on Ctrip.com (CTRP), a Chinese holding company that consolidates hotel accommodations and airline tickets. I listed a chart with the obvious pivot point of $58.50 on the cup with handle pattern. The stock went on to breakout but then violated the sell point forcing me to close the position. I never moved back into the stock but I can tell you that it never broke below the long term moving average support and has since gone on to make more than 35% (from the original pivot point).

The original case study is listed below with an updated chart to show you what has happened since we targeted the stock last summer. Timing is a key component when attempting to make money in stocks but cutting losses short is even more important. If you followed rules with this stock, you could have bought the original pivot point, sold for a small loss and then reentered at the 200-d m.a. or the last breakout to the up-side for the most recent gains.

Often times you will buy a stock that looks solid for the long term but buy it at the wrong time. This doesn’t mean that your stock selection was wrong; it just means that you must follow rules to eventually realize a profit (even if you are forced to sell one or more times). CTRP turned out to be a winning stock but not the way I anticipated when I added it to the MSW weekly screens (MSW Index) last year.

These are the updated institutional numbers (study them and then look at the difference from last August – numbers located below):

Number of Institutions (latest reporting period):
Total: 165
Money Mangers: 73
Mutual Funds: 87
Other: 5

New Positions: 51
Positions Sold Out: 37


ALL INFO BELOW THIS POINT FROM 8/23/05
CASE STUDY – Cup with Handle Setup
CTRP – Ctrip.com Intl ADS


Leisure Services - Transportation

Ctrip.com International, Ltd., a holding company, consolidates hotel accommodations and airline tickets in China. The company aggregates information on hotels and flights and enables its customers to make hotel and flight bookings. It also offers packaged-tour products and other travel-related products and services. The company enables its customers to choose and reserve hotel rooms in cities throughout China and selected cities abroad; book and purchase airline tickets for domestic and international flights originating from China; and choose and reserve packaged tours that include transportation, accommodation, and sometimes guided tours as well. It offers its services to customers through a transaction and service platform consisting of centralized toll-free, customer service center, and bilingual Web sites. It offers its services primarily to business and leisure travelers in China, who do not travel in groups. Ctrip.com International was founded in 1999 and is based in Shanghai, China.

CTRP has been making numerous daily screens over the past several weeks and a few “short lists” on our weekly screens. This past week, CTRP was one of the new stocks that we are watching on the weekly screen. After reviewing the fundamental numbers further and studying the chart, I decided that this stock would be best suited for a case study due to the cup with handle pattern formation.

The company smashed earning expectations in the second quarter of this year but gave a soft outlook for the third quarter. According to analysts, the company is usually hesitant when giving future expectations. Some analysts point to rising competition within the Chinese online travel industry, giving us lower expectations going forward. In any event, we can only go by past earnings numbers and current technical analysis. See our chart analysis under the “Chart Legend” section of this case study located below the fundamental breakdown of the stock.

Sister Stocks:
Ambassadors Group Inc. - EPAX
Intrawest Corp. - IDR
Bluegreen Corporation - BXG
Steiner Leisure Ltd. - STNR

Key Ratings:
Overall Rating in IBD: B+
EPS Rating: 76
Relative Price: 86
Industry Group Rank: 113 (of 197)

3-Year EPS Rate: 113%
3-Year Sales Rate: 83%
ROE: 28%
PEG: 1.13

EPS Analysis:
2003: 0.06
2004: 1.02
2005: 1.48 (E) High estimate: 1.62
2006: 1.98 (E) High estimate: 2.39

Revenue: (in millions)
2003: 173.00
2004: 334.00

Net Income: (in millions)
2003: 53.8
2004: 133.00

Number of Institutions (last reporting period):
Total: 38
Money Mangers: 21
Mutual Funds: 16
Banks: 1
Insurance Co.: 0

New Positions: 16
Positions Sold Out: 9

Chart Legend:
1. The stock started with an IPO in late 2003 with very volatile movement but then quickly started into a down-trend until bottoming out in May of 2004.
2. After a brief up-trend, the stock formed its first cup with handle base last summer and then exploded into a strong up-trend that took the stock from $34 to $55 in less than two months.
3. After the peak near $55, the stock formed our current pattern that has lasted for nine months with a nice shaped cup base and handle formation.
4. The only problem that I can see with the cup shaped pattern is the lack of strong volume on the right side of the base.
5. The handle has been forming for seven weeks with decreasing volume, an excellent sign of shaking out weak holders.
6. The pivot point was set $0.10 higher than the highest intraday high in the handle at $58.50.
7. A move above $58.50 on volume with at least 242k shares traded would qualify as a strong buy.

The general market is not healthy but some stocks tend to defy the general market trend and follow through for a breakout. The ideal situation would have the stock breaking out while the market is starting to breakout, confirming that the stock may be a market leader in the next rally.

If the stock breaks out and you buy, make sure your mental sell stop is already placed in your head or on paper. If the stock fails after the breakout and your stop area is triggered, DO NOT hesitate later date if the timing is wrong. The ‘M’ in CANSLIM is not healthy so the stock can give a false breakout.

Piranha

Monday, March 13, 2006

Can HANS do it Again?

CASE STUDY – Can HANS do it Again?
HANS – Hansen Natural Corp.


Beverages – Soft Drinks

Company Profile:
Markets, sells and distributes beverage category natural sodas, fruit juices, energy drinks, lemonades and orangeades

Hansen Natural Corporation. The Group's principal activity is to market, sell and distribute beverage category drinks. These include natural sodas, fruit juices, energy drinks, sparkling lemonades and orangeades, non-carbonated ready-to-drink iced teas, lemonades, juice cocktails and energy sports drinks, children's multi-vitamin juice drinks and nutrition bars and cereals. The Group also markets and distributes energy drinks under the Monster(TM) brand name. In addition, it markets nutrition bars and cereals under the Hansen's(R) brand name. Its fruit juices for toddlers and malt-based drinks are marketed under the Junior Juice(R) and the Hard e(TM) brand names. The Group's operations are conducted through wholly owned subsidiaries Hansen Beverage Company ('HBC') and Hard Energy Beverage Company ('HEB'). The customers of the Group include, Costco, Trader Joe's, Sam's Club, Vons, Ralph's, Wal-Mart, Safeway and Albertson's. - Profile provided by Ameritrade.

Hansen first entered my life a as $60-$100 candidate back in May 2005 before the most recent split adjustment. Using the non-split adjusted price of $66.56, HANS quickly moved through the infamous range within two months. After consolidating for another two months, I sold my shares and also removed it from the MSW Index. The consolidation period went on to form for a total of four months as the stock split 2-for-1.

After the stock split, HANS broke out once again towards the $60 range and I jumped back in and started coverage on the MSW index for the second time in one year. This time, the stock bolted from $60 to $80 in six weeks and then traded sideways for five weeks before breaking out once again and completing another $60-$100 range. A quick reversal from $100 forced me to take profits and eventually remove it from the MSW Index in January 2006. I also sold these shares due to the weakening market as told by the NH-NL ratio and the individual leaders (HANS being one of them).

Recently, the stock has been forming yet another base (8 weeks) while holding the long term moving averages. HANS broke out to a new high last week and we screened it on our daily charts and have it sitting on our weekly honorable mention list (looking for a new entry area before adding it back to the MSW Index). I have not bought back into HANS for a third time but I am looking for the opportunity. Without using the split adjusted price, I have bought shares at $66.56 and $115.26 (now I am looking to place a new position above $200 per share).

Stocks that make new highs typically continue to make additional new highs unless the trend changes! The trend hasn’t changed for this stock YET! Let’s take a look at the financials that have fueled this all-star stock over the past two years. Remember, I bought at $66 after the run-up from $15 to $60.

Sister Stocks:
Glacier Water Services – GWSV
Jones Soda – JSDA
Leading Brands – LBIX
National Beverage - FIZ

Key Ratings:
Overall Rating in IBD: A+
EPS Rating: 99
Relative Price: 99
Industry Group Rank: 41 (of 197)

3-Year EPS Rate: 178%
3-Year Sales Rate: 58%
ROE: 68%
PEG: 1.53

EPS Analysis (yearly):
2001: 0.14
2002: 0.14
2003: 0.28
2004: 0.87
2005: 2.59
2006: 3.64 (E)
2007: 4.49 (E)

EPS Analysis (quarterly):
Q1 (2004): 0.09
Q2 (2004): 0.22
Q3 (2004): 0.25
Q4 (2004): 0.31

Q1 (2005): 0.37
Q2 (2005): 0.31
Q3 (2005): 0.83
Q4 (2005): 0.75

Revenue: (in millions)
2001: 92.28
2002: 92.05
2003: 110.3
2004: 180.3
2005: 348.9

Net Income: (in millions)
2002: 3.03
2003: 5.93
2004: 20.4

Pretax Income (in millions):
2002: 5.07
2003: 9.76
2004: 33.9

Total Assets (in millions):
2002: 40.5
2003: 48.0
2004: 82.0

Key Stats in 2005:
Annual 2005 EPS: $2.59 vs. $0.87
Q1 EPS: $0.73 vs. $0.19 (not split adjusted)
Q2 EPS: $0.63 vs. $0.22 (not split adjusted)
Q3 EPS: $0.83 vs. $0.24
Q4 EPS: $0.75 vs. $0.31

Number of Institutions (last reporting period):
% Shares held by Institutions: 49%
Total Institutions: 383
Money Market: 175
Mutual Funds: 200
Other: 8
New Positions Bought: 113
Existing Positions Sold: 37
Top Mutual Fund Holder: Fidelity Low-priced Stock Fund (1.5 mil shares)

Piranha

Friday, March 10, 2006

Is the NH-NL Ratio reliable?

Based from the blog earlier in the week, I have updated the NH-NL ratio chart using the latest figures from the weekly averages. As you can see, the NH-NL ratio has been playing see-saw with the 80% positive/neutral line. With the NH-NL ratio staying below 500 new highs per day, we should not expect the line to travel in positive territory.

If you are skeptical about the line plotting above the 80% positive level, let me remind you of early 2004 when the NH-NL ratio was still extremely powerful (the end of the 2003 bull run):

January 2004:
1/06/04: 856-11
1/08/04: 966-9
1/09/04: 823-11
Weekly average: 97.5%

1/12/04: 823-11
1/13/04: 684-8
1/14/04: 776-9
1/15/04: 788-5
1/16/04: 889-4
Weekly average: 98%

1/20/04: 1,142-8
1/21/04: 950-3
1/22/04: 846-7
1/23/04: 646-6
Weekly average: 98.5%

1/26/04: 796-7
1/27/04: 724-8
1/28/04: 511-9
1/29/04: 206-10
1/30/04: 286-5
Weekly average: 96%

The ratio started to turn neutral in March 2004 and we saw the first negative NH-NL ratio on April 14, 2004 when it finished at 102-135 (a major red flag). Looking at the chart for the NASDAQ (going back to 2003 and 2004), you can see that this ratio perfectly showed the start of the decline from March to August after the tremendous bull rally of 2003.

Now those are amazing and reliable readings!


Piranha

Wednesday, March 08, 2006

A Negative New High-New Low Ratio (NH-NL)

We witnessed our first negative daily New High–New Low (NH-NL) ratio since Wednesday, November 16, 2005 when it closed at 103-207. The NH-NL ratio closed at 88-93 on Tuesday as the market presented us with the fewest number of quality stocks making new highs since last year. I have been backing off of the idea that a “rally” has been forming as claimed by other market sources and I have pointed to my three main indicators to explain why I have been playing defense since early February. Below I have listed some of the quotes that I made on the weekly screen from 2/11/06. On Monday, the NH-NL ratio finished at 271-77.

I have pasted the weekly NH-NL numbers from that week in November to show you what the market looked liked back then.

NH-NL ratios from :11/14/2005 to 11/18/2005
Monday showed a ratio of 275-130
Tuesday showed a ratio of 152-183
Wednesday showed a ratio of 103-207
Thursday showed a ratio of 297-147
Friday showed a ratio of 415-106

Below is an updated look at the weekly averages for the NH-NL Ratio:
Saturday, October 1, 2005: 255-116
Saturday, October 8, 2005: 197-144
Saturday, October 15, 2005: 46-317
Saturday, October 22, 2005: 73-220
Saturday, October 28, 2005: 111-162
Saturday, November 5, 2005: 241-93
Saturday, November 12, 2005: 231-111
Saturday, November 19, 2005: 248-155
Saturday, December 02, 2005: 312-73
Saturday, December 10, 2005: 309-77
Saturday, December 16, 2005: 293-104
Saturday, January 7, 2006: 473-47
Saturday, January 14, 2006: 500-32
Saturday, January 21, 2006: 348-46
Saturday, January 28, 2006: 516-46
Saturday, February 4, 2006: 449-44
Saturday, February 11, 2006: 229-57
Saturday, February 18, 2006: 306-42
Saturday, February 25, 2006: 420-36
Saturday, March 4, 2006: 399-49


2/11/06 Weekly Screen Quotes:
“A few weeks ago, I held six traditional stock positions and have been forced to sell all but two positions.”

“As I said above, I have been locking in profits and moving to cash.”

“This week, the ratio averaged 229 new highs per day, the weakest number since the week of October 28, 2005 when we had a negative ratio. The new lows gave us the largest average since the week of December 16, 2005 when it was above 100 stocks per day. Above everything else, I turn to the NH-NL ratio to gauge the strength among the leaders and I allow the ratio to help me decide when it’s time to use margin and when it’s time to start moving to cash (and vice versa).”

The chart in this blog post shows a graph that highlights the strength and weakness on the NH-NL ratio during the second half of 2005. I will update the graph with the latest data and post it up tomorrow. To calculate the percentage correctly, use this formula: (New Highs – New Lows) / (New Highs + New Lows) * 100 = X%

Piranha

Monday, March 06, 2006

Top 10 Shorting Opportunities on MSW in 2005

MSW follows the trend and isn’t shy from covering stocks that I feel will drop in price. Late last winter (2004-2005), I turned bearish and started to cover stocks that I felt would drop in price and present us with shorting opportunities. I am bullish by nature as are most humans but I am also in the market to make money so I must follow the path of least resistance. The table inserted in this blog post shows us the top shorting opportunities on MSW in 2005.

You will notice that we stopped covering our short stocks at the end of April 2005, precisely the time that many of these stocks bottomed before starting to move higher. I am not taking credit for calling the market low but my NH-NL ratio started to change direction so I quickly changed my perspective. The NH-NL ratio nailed this low on its head!

The week ending on 4/30/05 had a NH-NL ratio list that looked like this:
Monday showed a ratio of 92-142
Tuesday showed a ratio of 76-204
Wednesday showed a ratio of 64-296
Thursday showed a ratio of 66-336
Friday showed a ratio of 68-341

The following week (5/7/05), the week I started to turn from bearish to bullish looked like this:
Monday showed a ratio of 105-176
Tuesday showed a ratio of 97-159
Wednesday showed a ratio of 128-121
Thursday showed a ratio of 152-85
Friday showed a ratio of 141-106

I also started the 5/7/05 weekly screen with this quote:
“Last week we highlighted a “sea of red flags” while this week we will highlight stocks that are showing solid relative strength versus their peers and the rest of the market. Typically, stocks that show the strongest characteristics and relative strength during corrections, bear markets and sideways markets, are usually the stocks to lead the next rally.”

Stocks that were making screens at this time were HANS, CBG and TS and they all became leaders.

My three prime tools for conveying market direction are:
1. Price and Volume of the Major Indexes
2. NH-NL Ratio
3. Behavior of Individual Stock Market Leaders


Piranha

Friday, March 03, 2006

Don’t shy away from High Priced Stocks

Why do investors buy low priced stocks, thinking they can double quicker than a stock priced over $100?

Over the past three months, Tenaris (TS) has gained 46% even though it is priced over the triple digit threshold. It is up almost 200% in one year! Too many times I see investors shy away from solid investments due to the high price level and/or the large prior advance. I have added strong stocks to the MSW Index time and time again that are priced relatively high when compared to most stocks but not high when compared to what the market believes they are worth: (i.e.: AAPL, HANS, TS, WFMI, GOOG). CME may have looked high at $100, $200, $300 and then again at $400 but it continues to move higher. Learn to forget about actual price and start to focus on actual percentage gains.

Realize that 46% is the same whether a $123 stock increases to $179 or a $5 stock jumps to $7.30. By the way, take Sirius as an example, it has actually moved from $7.12 on December 2, 2005 to $5.08 today. Doing a quick newspaper search, you will see many analysts and talking heads hyping that stock prior to Howard Stern leaving the air. What happened? People were trying to buy speculation, not fundamentals and technicals. TS is up 46% since 12/2/05 while SIRI is down almost 30%.

Don’t buy into the idea that lower priced stocks move faster and can provide quicker routes to riches – THAT IS FALSE! They will most likely provide quicker routes to ruin! In the past week, I have actually heard someone say that they were buying more shares if SIRI broke below $5 and couldn’t wait to do so! Good money after bad has never made anyone a profit. Good Luck, I am happy with my money in BOT (even if it doesn’t work out because my sell rules will protect me from dropping 30% in my position).

***Look at the chart comparison of a stock we recommended at $65 one year ago today and one that was priced near $6 per share with a TON of speculation! The high priced $65 stock is now trading above $180 in a strong up-trend and the low priced stock is now trading at $5 in a down-trend.

Here is a link to an article by another trader I respect: He talks about the reason why traders could afford Google last year (note: I started to cover the stock at $172 and cut it at $281 – I wasn’t in at the bottom or out at the top but I made a profit).

*Note that the article is from 2005 (not present day)
Yes, You can Afford Google

Piranha

Wednesday, March 01, 2006

Is BOT the next CME?

I wrote a new case study earlier today on CBOT Holdings (BOT) and realized the huge upside potential based on the lack of support by institutional sponsors in its early days on Wall Street.

The stock debuted in October and has since developed a cup shaped base without a handle (at this time) and has resistance at $120. A breakout above $120-$122 is a buy signal and the “high” price at this level should not discourage investors.

What is high to some investors may be low to others. If you question this theory, take a quick look at the multi-year chart for Chicago Merchantile Exchange (CME). That stock has moved from $60 to more than $400 in the past two years.

Here is a simple snapshot of the Institutional Sponsorship for BOT:

Number of Institutions (most recent reporting period):
% Shares held by Institutions: 3%
Total Institutions: 69
Money Market: 49
Mutual Funds: 19
Other: 1
Top Institutional Holder: Mazama Capital Management, Inc. (606,932 shares) 0.01% of portfolio


What interests me the most is the fact that only 3% of the shares on the market are held by major institutions such as money managers and mutual funds. When compared to CME, we can see that 280 money market mangers, 486 mutual funds and 24 other institutional investors currently hold positions in this stock. If BOT was to follow in the footsteps of CME, based on these stats alone, I am eager to establish a position right now! CME also has a 72% institutional sponsorship rating.

Piranha